Bulk-generate & schedule posts in seconds with Smart Scheduling. Try now!
ContentStudio 2.0 Preview – The New Discovery
The primary goal of our team in the second half of this year has been to build a better, faster and more user-friendly ContentStudio. This post is a first of many to come as we are starting to lift the curtains to unveil our crown jewel.
With the immense popularity of personalized content amongst individuals and digital/ media agencies, it was only imperative that we brought to our treasured clients an even better experience.
Our focus was to create an experience which would overcome the inherent challenges of discovering and sharing highly-relevant and engaging content.
So after months of hard work and loads of coffee, we are bringing to you the all-new Discovery 2.0 very soon.
With lightning speed, sleek and modern UI and features that will streamline your content discovery and intelligence, version 2.0 is made with only one thing in mind and that is to amaze you!
Now, let’s look at what’s new and what’s better than before.
Our Approach
With the evolution of machine learning algorithms, we have stepped up our game as well. Through your valuable feedback and our interactive social channels, we were able to pin down your pain points.
In the existing version, it was a bit hard for some users to find content specific to their particular niche. And there are multiple reasons for that including limited content production in their niche, difficulty in creating custom topics and not enough pre-curated content topics.
So, here’s how we have tried to tackle the problem.
- We have built a new backend infrastructure from ground-up for content crawling so that you find good content every time.
- We have changed the content scoring algorithm and introduced new factors to bring in the most relevant content you want to see.
- New query builder with a different but easier approach and covering all the cases (OR, AND, NOT) between keywords and domains.
- Roughly 500 curated topics covering almost every industry and interest have been added so that you can follow the relevant topics quickly.
- Making the search even more powerful with search assistant.
- Detailed content insights to help marketing, sales and PR teams make better decisions with the help of data.
- How many times an article is shared on Reddit has been added to the engagement data.
- Sentiment analysis of each article can be seen.
- Trending score and relevance filters have been improved.
- Cover stories on the homepage of discovery for the topics you are following.
- NSFW filters have been further improved.
We managed to integrate your observations into the new system (thanks to the feedback you have been providing us) and it has allowed us to come up with a highly sophisticated yet robust application.
Let’s dig a bit deeper into the features.
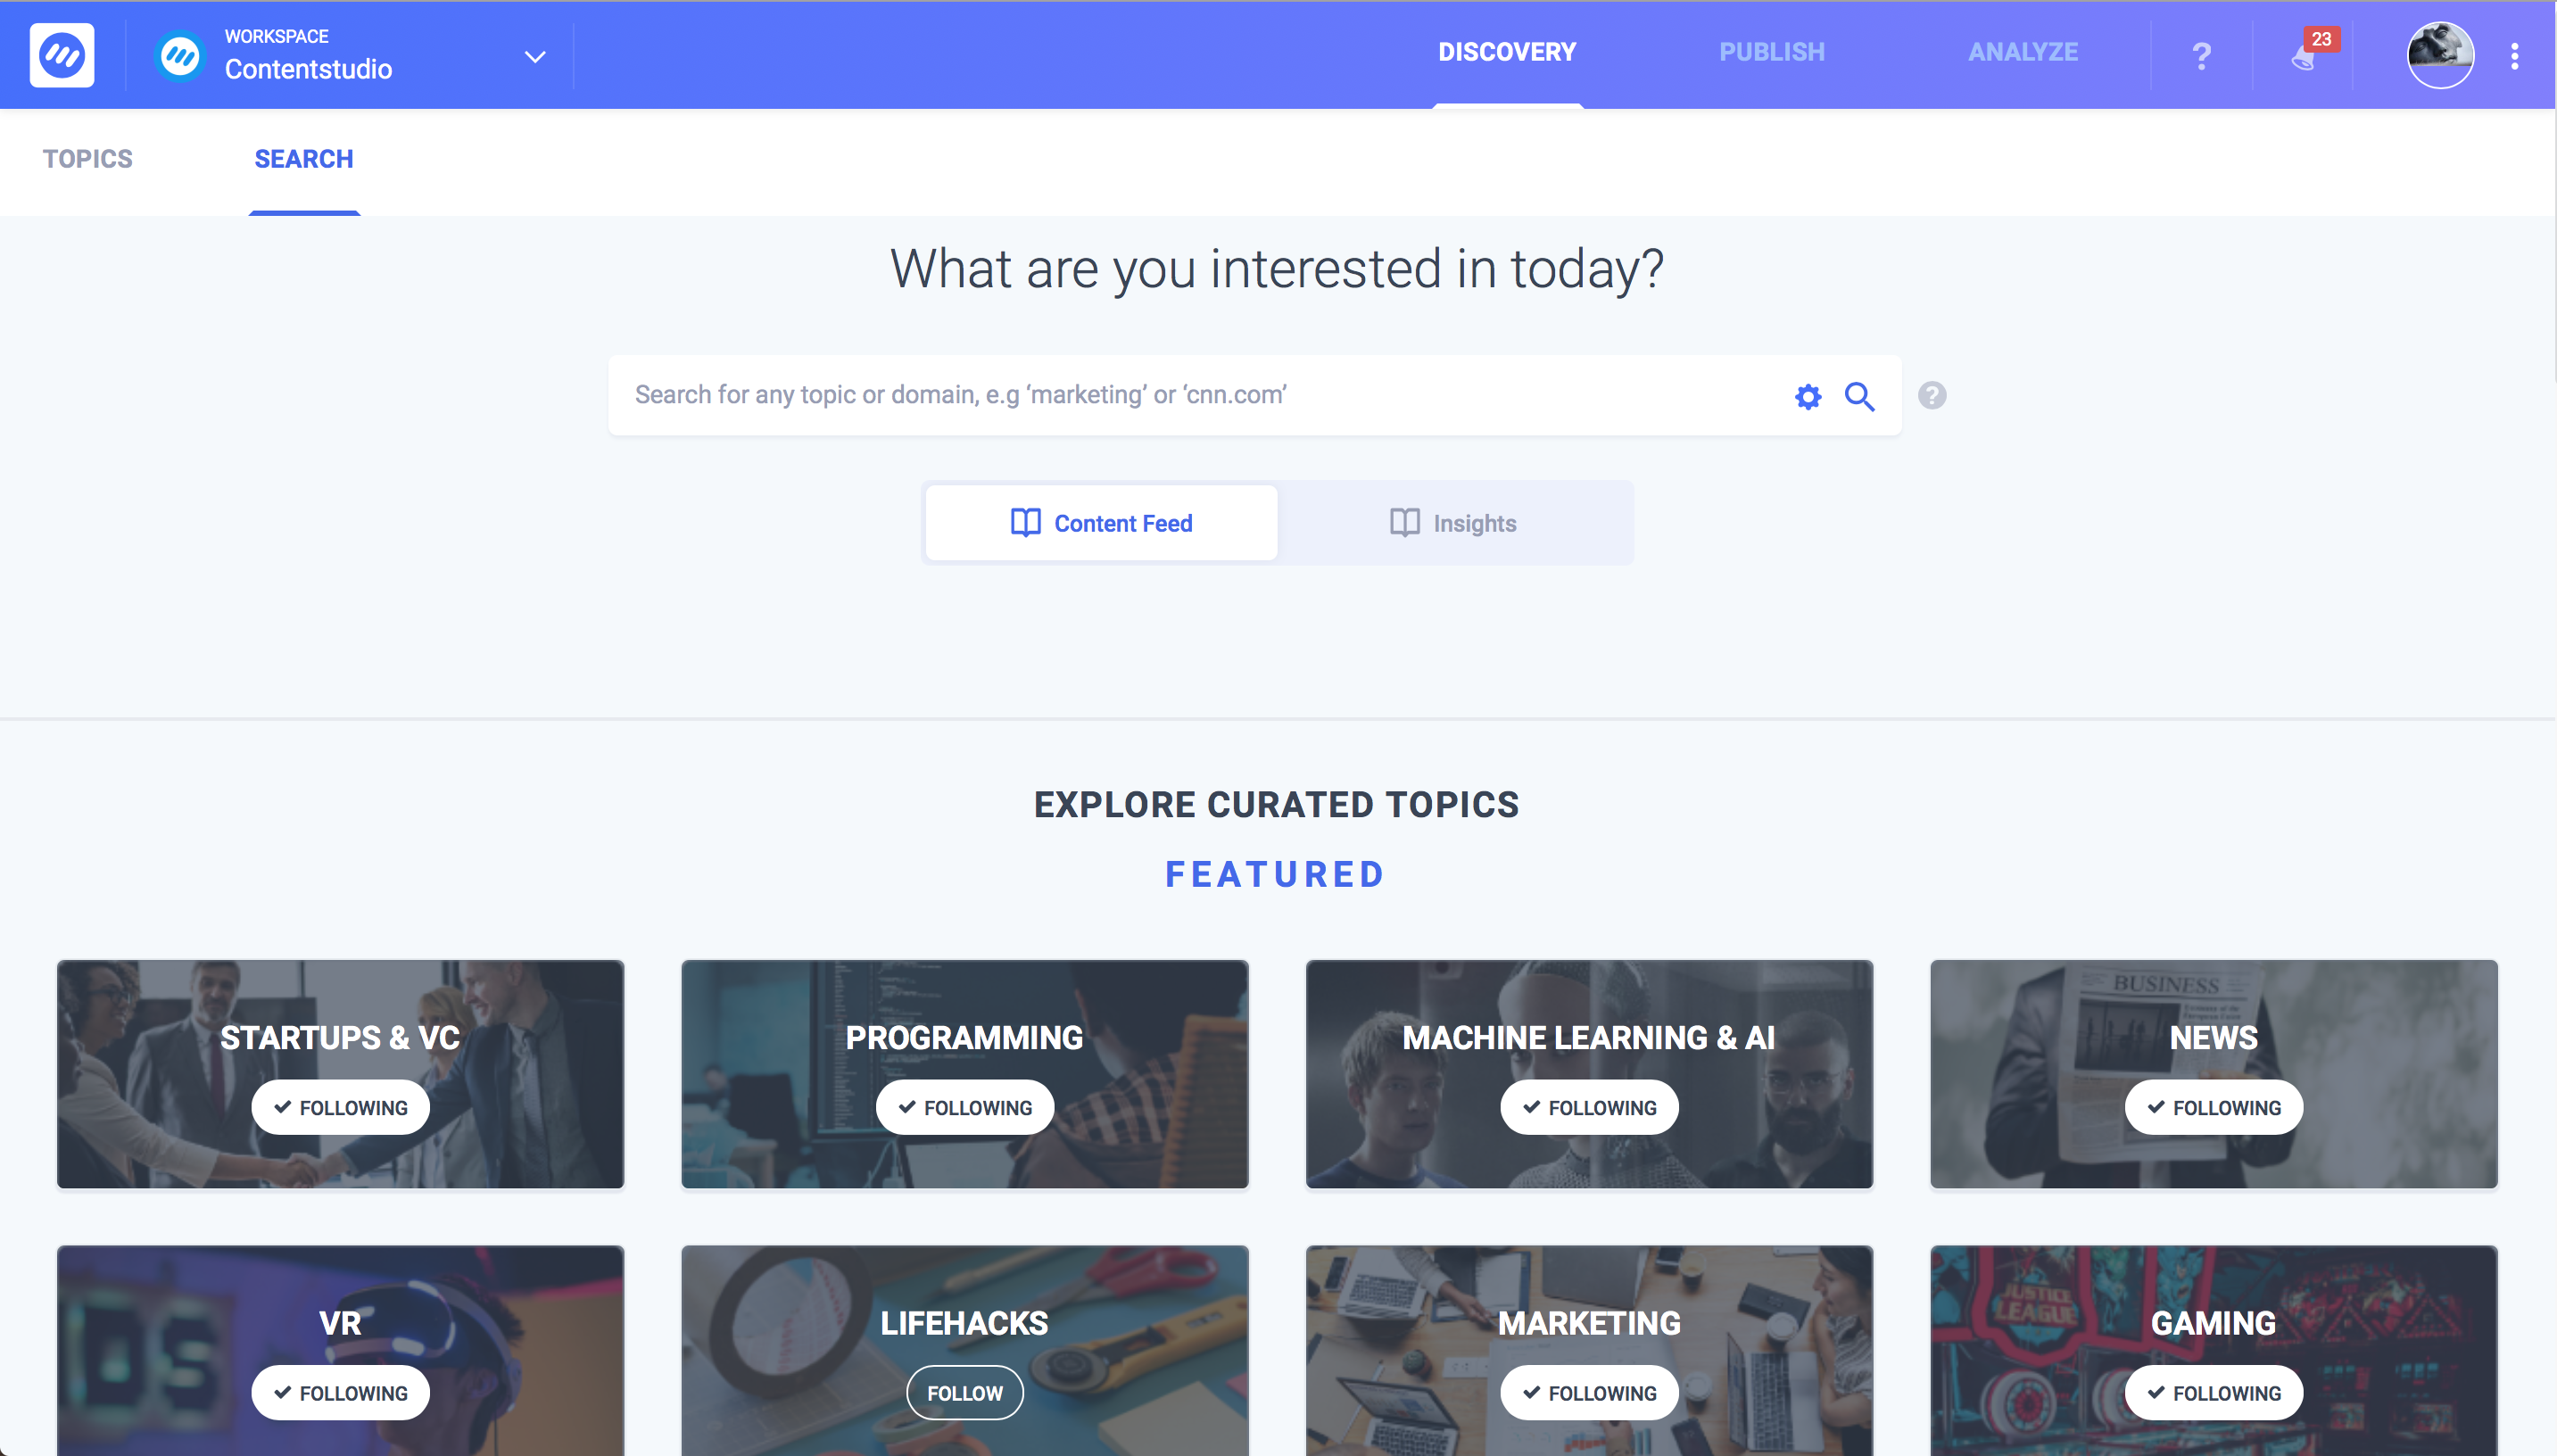
So the discovery tool has been divided into 2 mini-modules and they are Topics and Search.
Search
In order to provide a great search experience, we have rehauled the entire search process so as to make your life easier. The tier based approach addresses the fundamental problem in searching i.e. finding niche relevant and keywords specific content.
We start from the very basic question “What are you interested in today?”. Clicking the help icon assists you in choosing the correct search patterns and it is done with the help of examples.

You get a total of 12 search patterns for doing a more targeted search. Identifying the right search patterns that fit your need will bring out targeted results.
Topics
Topics are your saved content feeds that you want to visit almost every day to see what’s new in your feed.
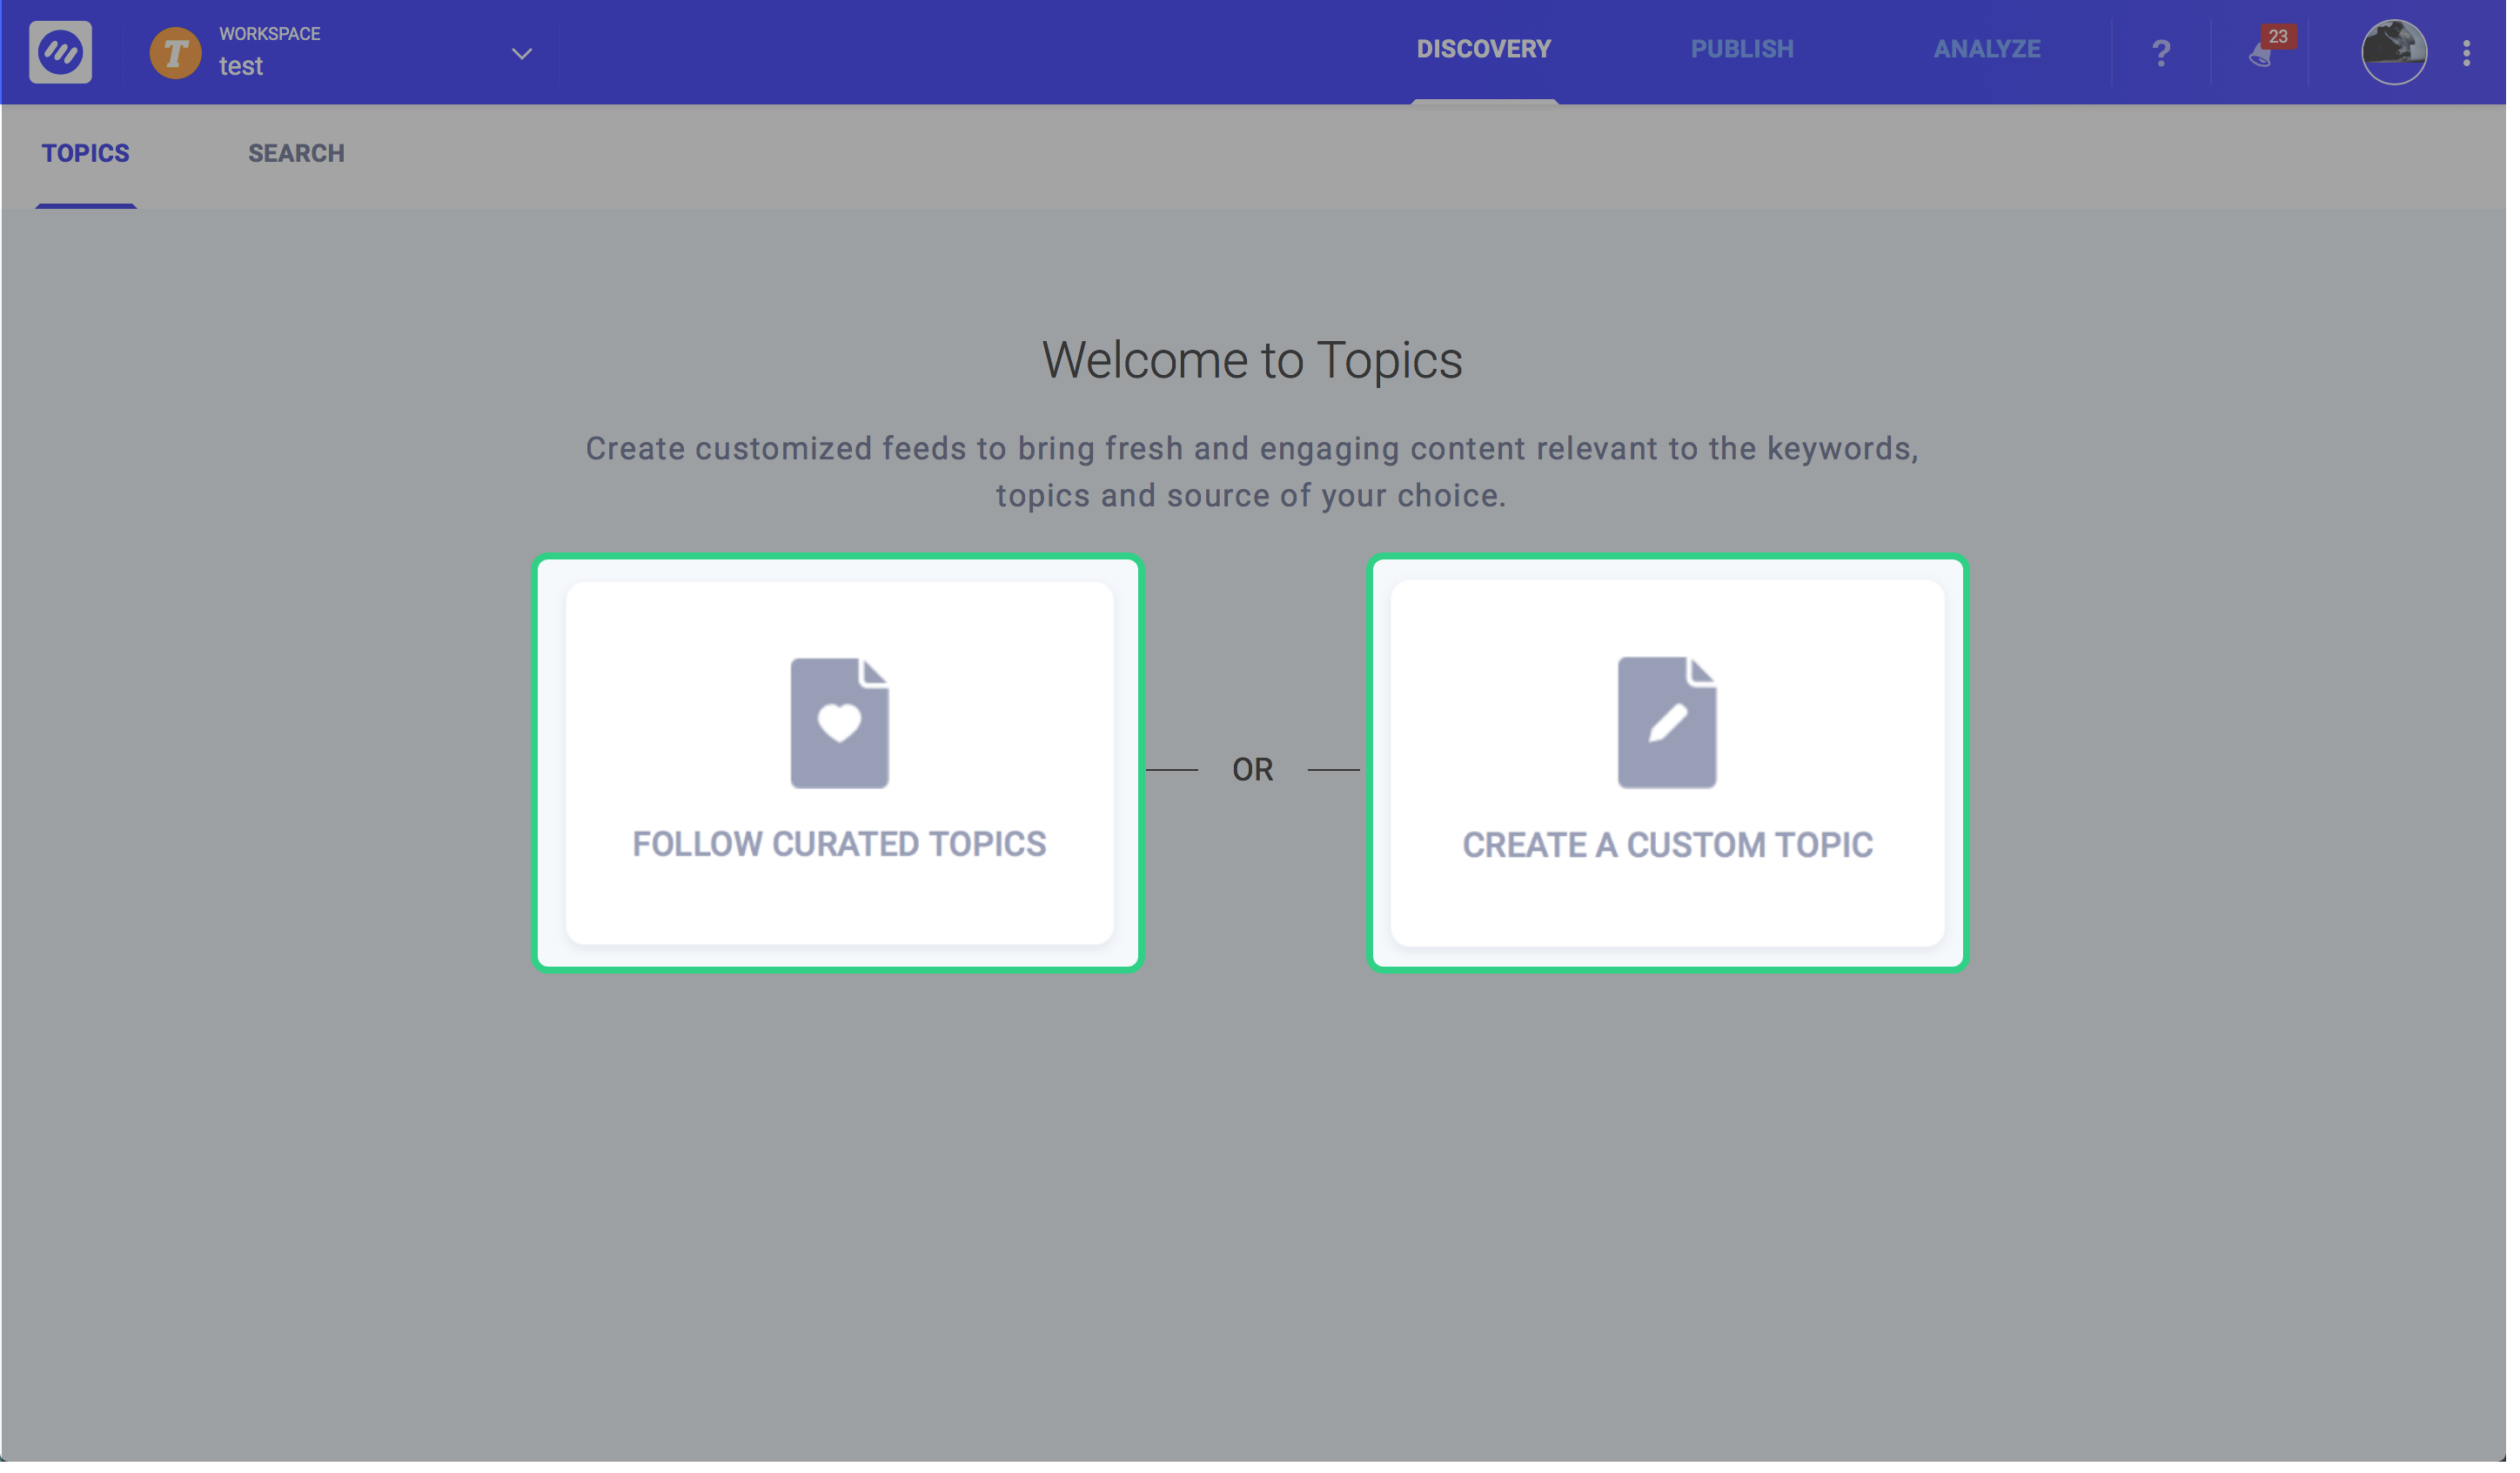
When you first arrive in the discovery, you get the option to follow curated topics or create custom topics.
While selecting topics to build your custom feed, we have introduced a clever system which suggests you closely matched topics.
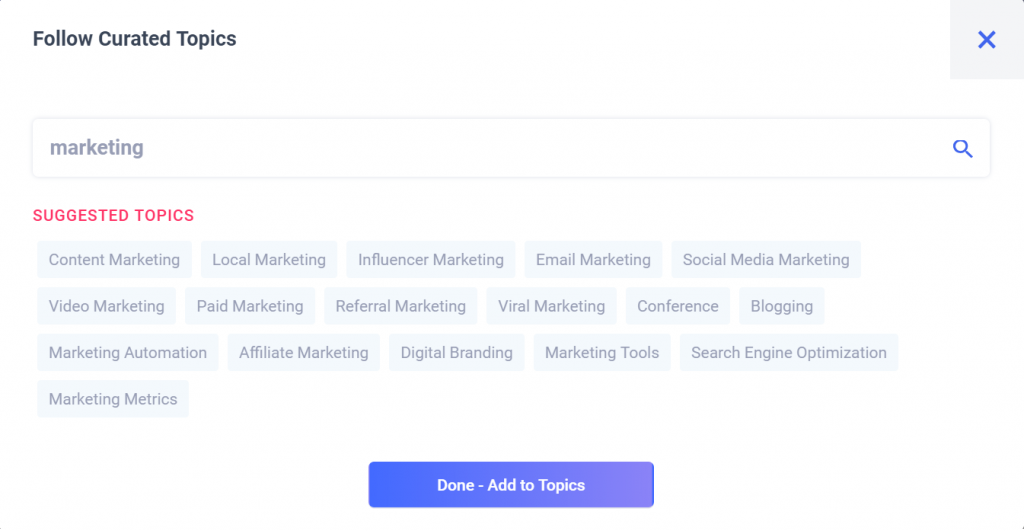
This method ensures that you receive closely matched topic suggestion in order to widen your search horizon and bring in more relevant and engaging content.
Curated topics
Content searching is effortlessly performed in version 2.0 by using a tier-based topic modeling technique. Segregating the topics in 3 tiers, we are currently supporting almost 500 curated topics covering a wide array of interests.
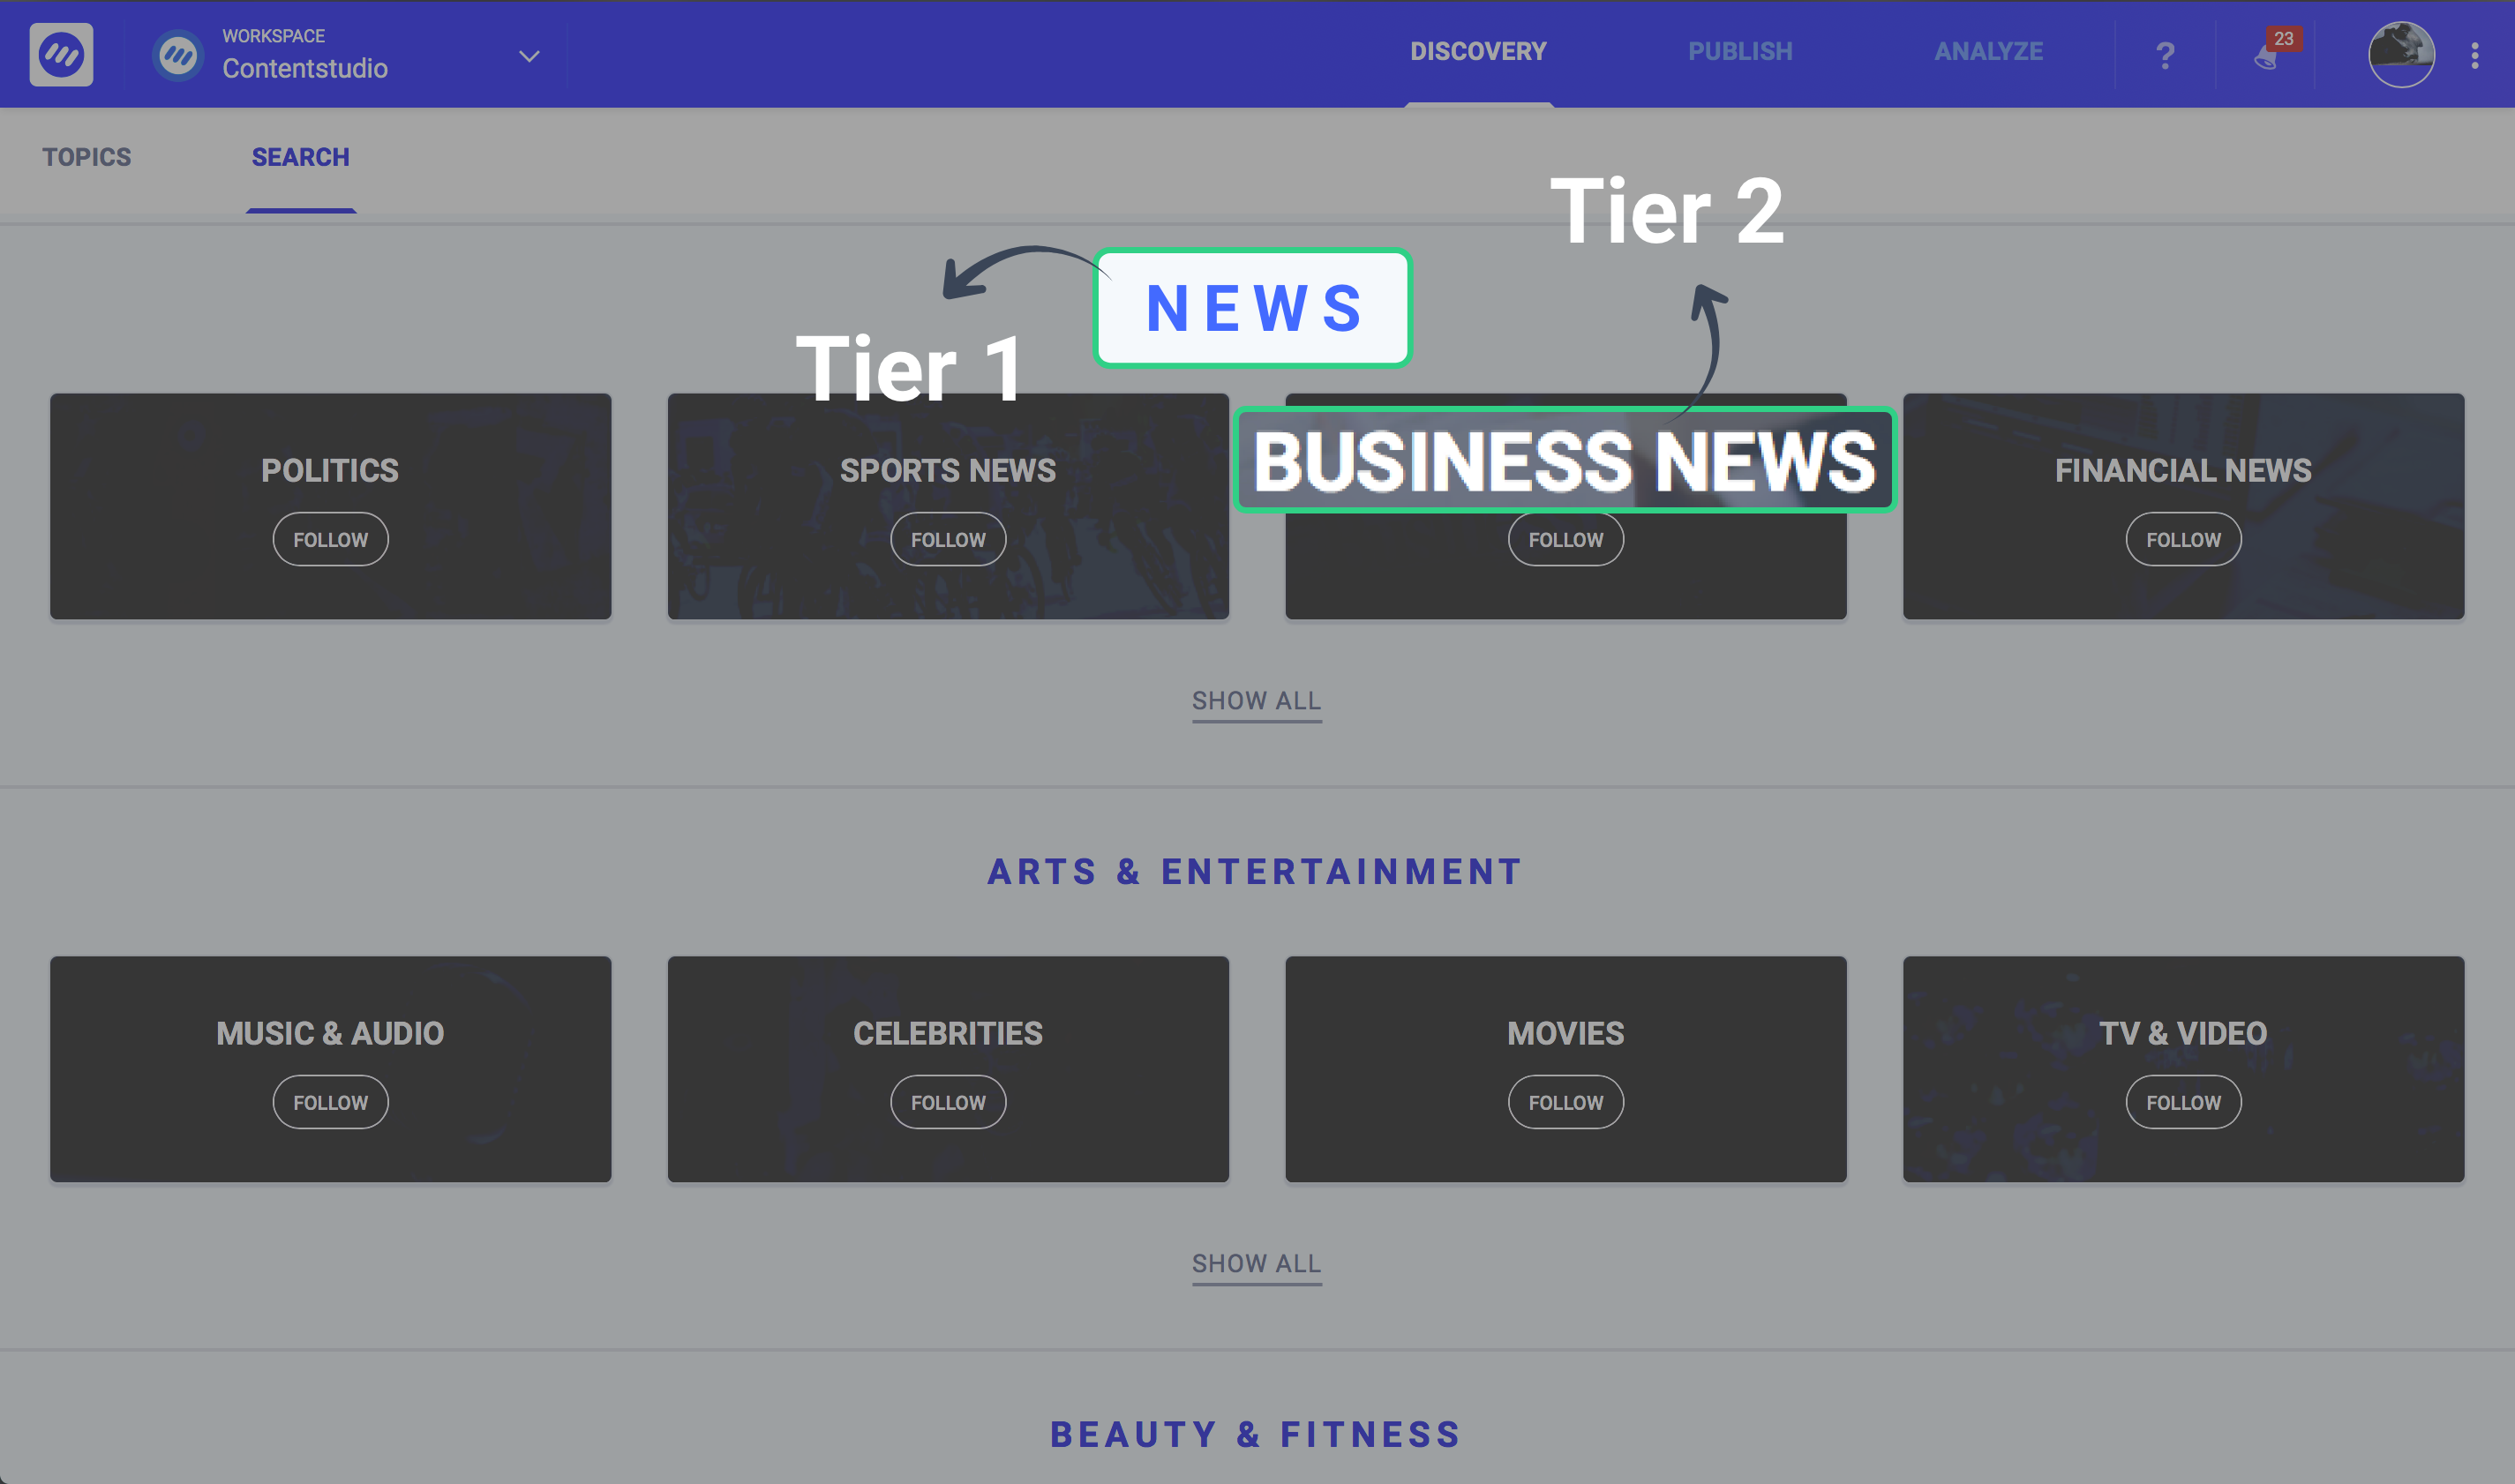
Our algorithm learns the context of the words being used in an article and assigns it a topic based on statistical relationships between input phrases and output topics and has been trained on a large dataset with the most modern machine learning techniques.
Custom topics with improved query builder
Searching for new content and creating custom topics is easier than ever before. We have reconditioned the query builder so that it returns the best results.
Applying both science and technology to come up with the scheme behind it, We have managed to ensure that all possible search combinations are catered for. Reading this section will help you effectively use the query builder and save tons of searching time in the future.
There are 2 main methods via which you can start creating your custom topic feed. First one lets you do that by searching for particular topics and keywords. The second one enables you to select domains first as sources for content.
Method 1: Adding topics and keywords first
A noteworthy concept to grasp is that our search engine works differently than that of Google. The sole purpose of the query builder is to find fresh and relevant content specific to your need.
For this we rely on Boolean operators in the backend which are “AND”, “OR” and “NOT”. Let us show you how to effectively use the query builder.
First of all, select an appropriate name for your custom topic e.g. digital marketing. Now let’s suppose you want content related to social media marketing. You have the option to match this topic in the title of an article or do it both in the title and the body content/ description.
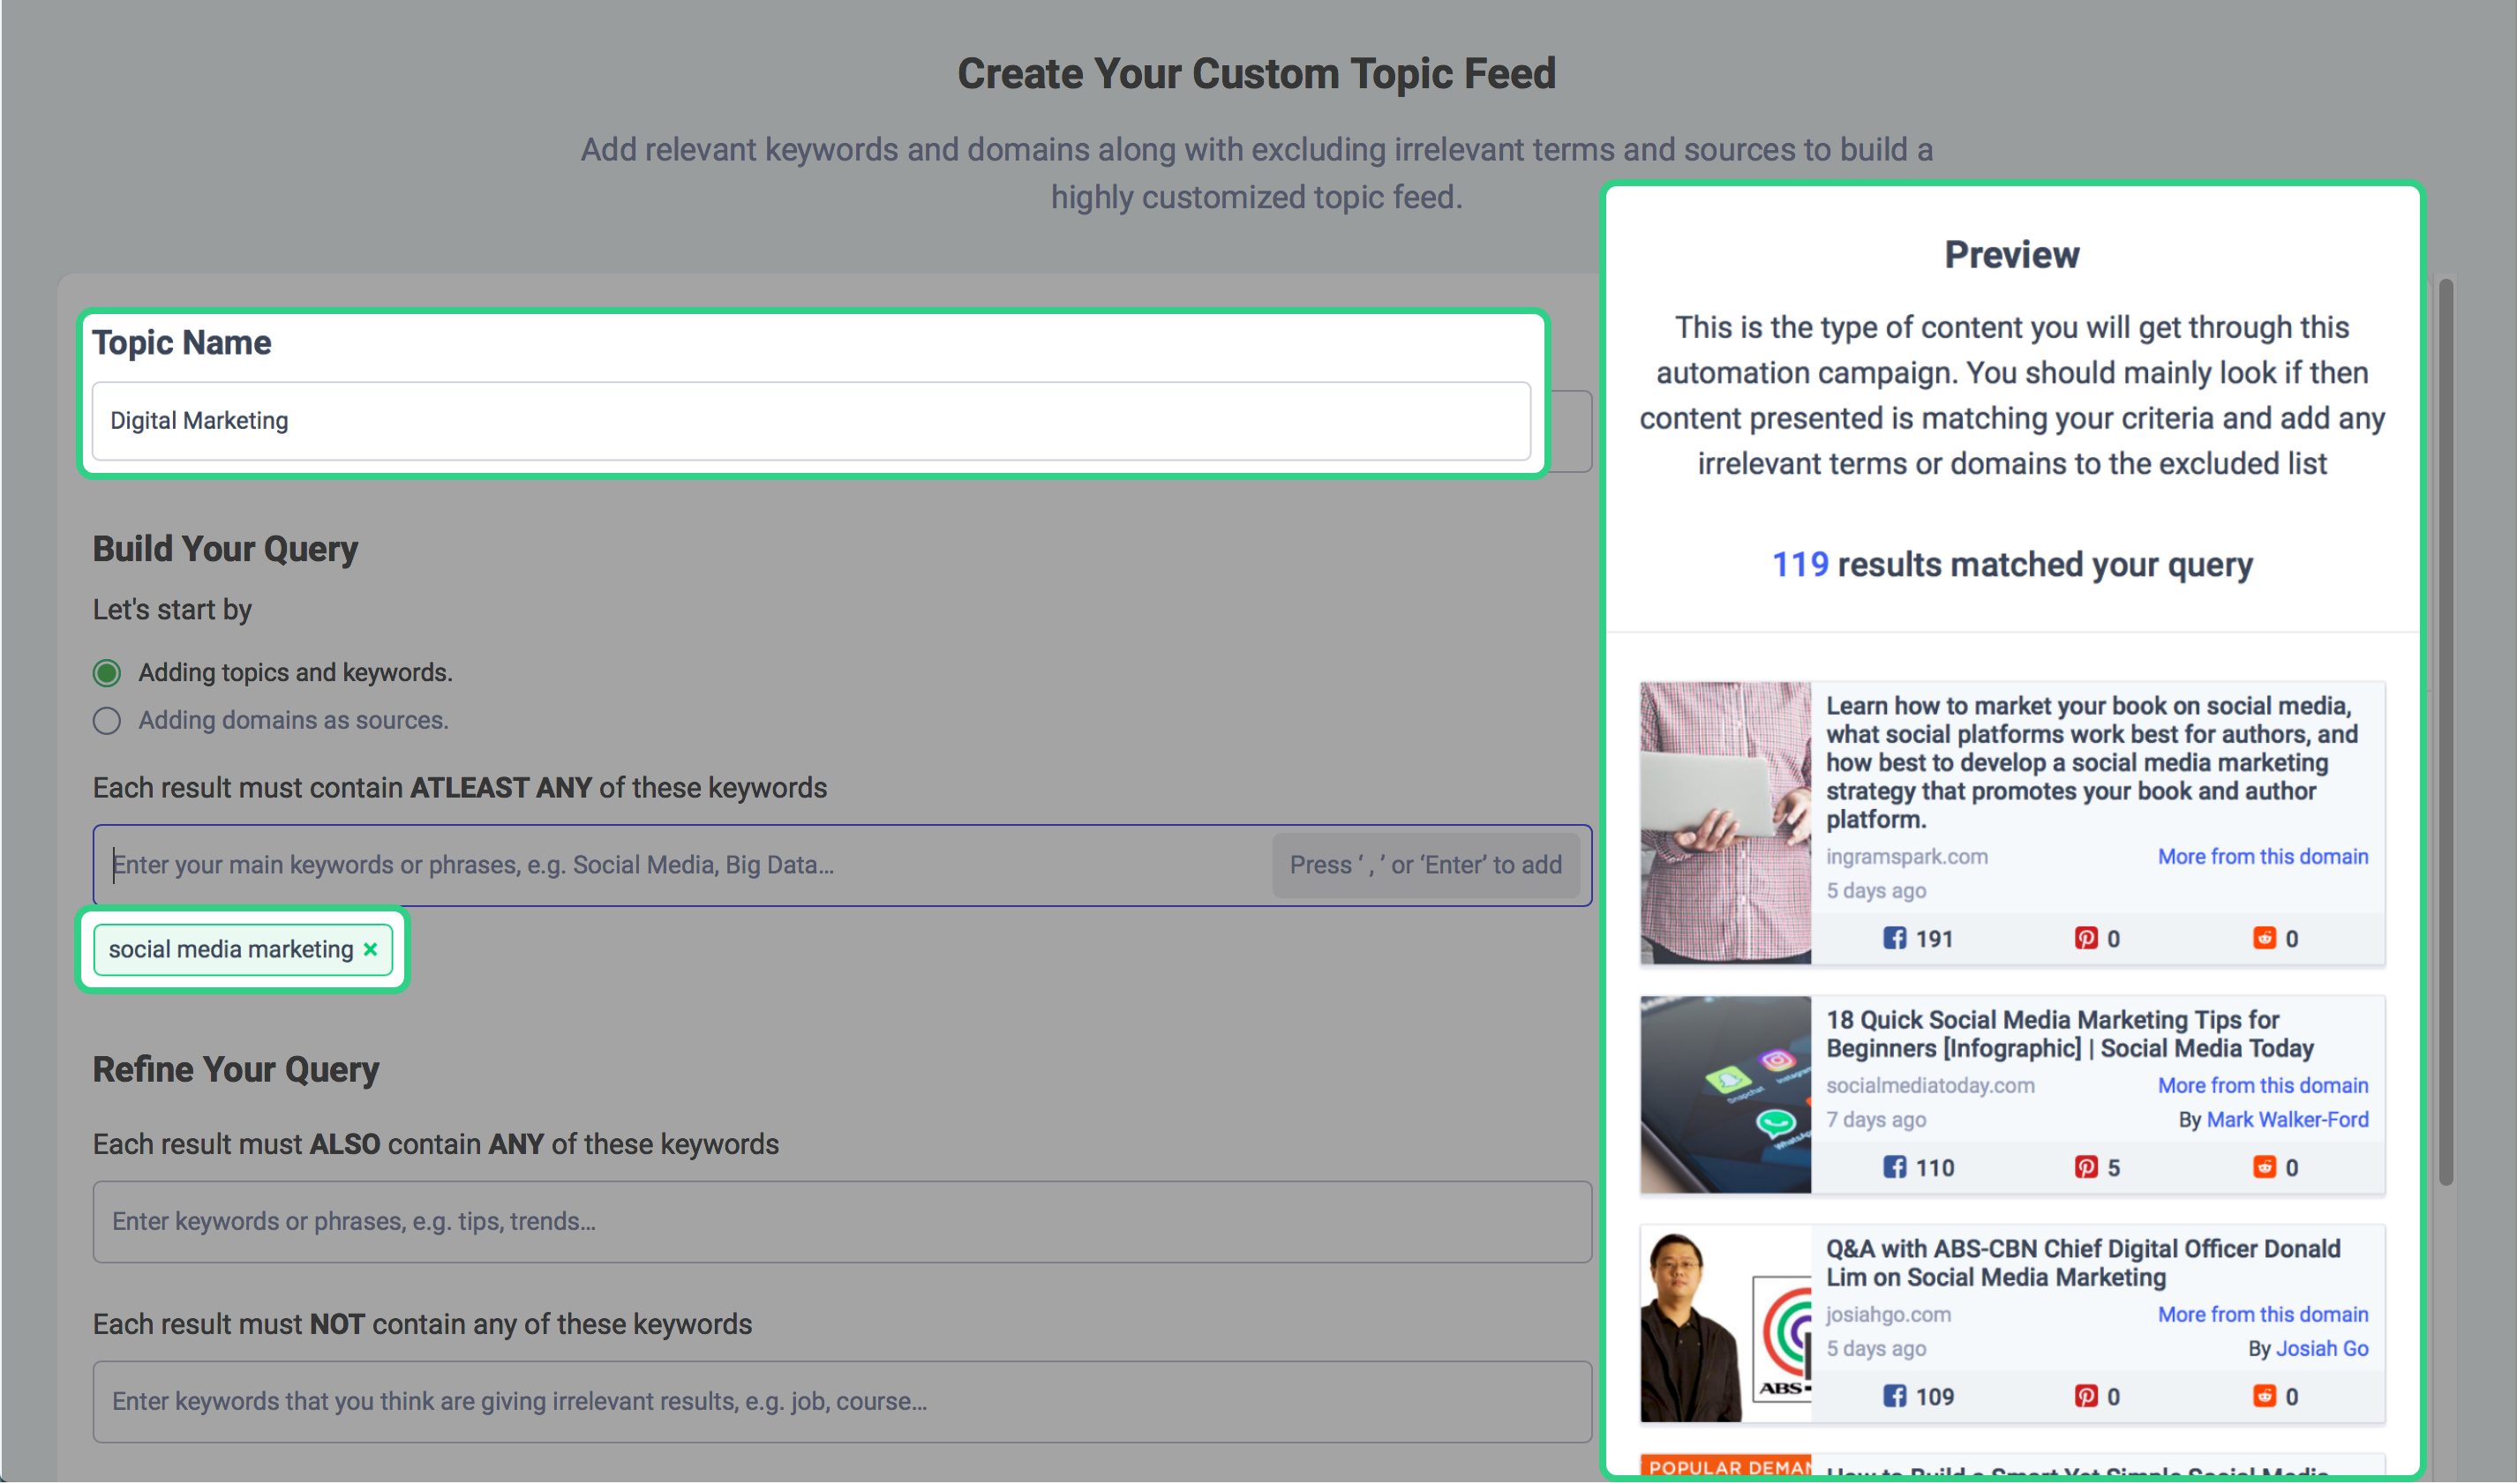
The statement reads “ Each result must contain at least ONE of these keywords”.
Each result will contain the term “Social media marketing” in its title or both title and the body content/description as per your previous choice.

The preview section on the left shows you the exactly matched articles from your search query. This helps you visualize your search query in real time
Example 2 – Going broad
The “OR” boolean operator includes all three words i.e. social, media, marketing in the search
Query: (Social OR Media OR Marketing)
Our engine will try to match these words in each piece of content.
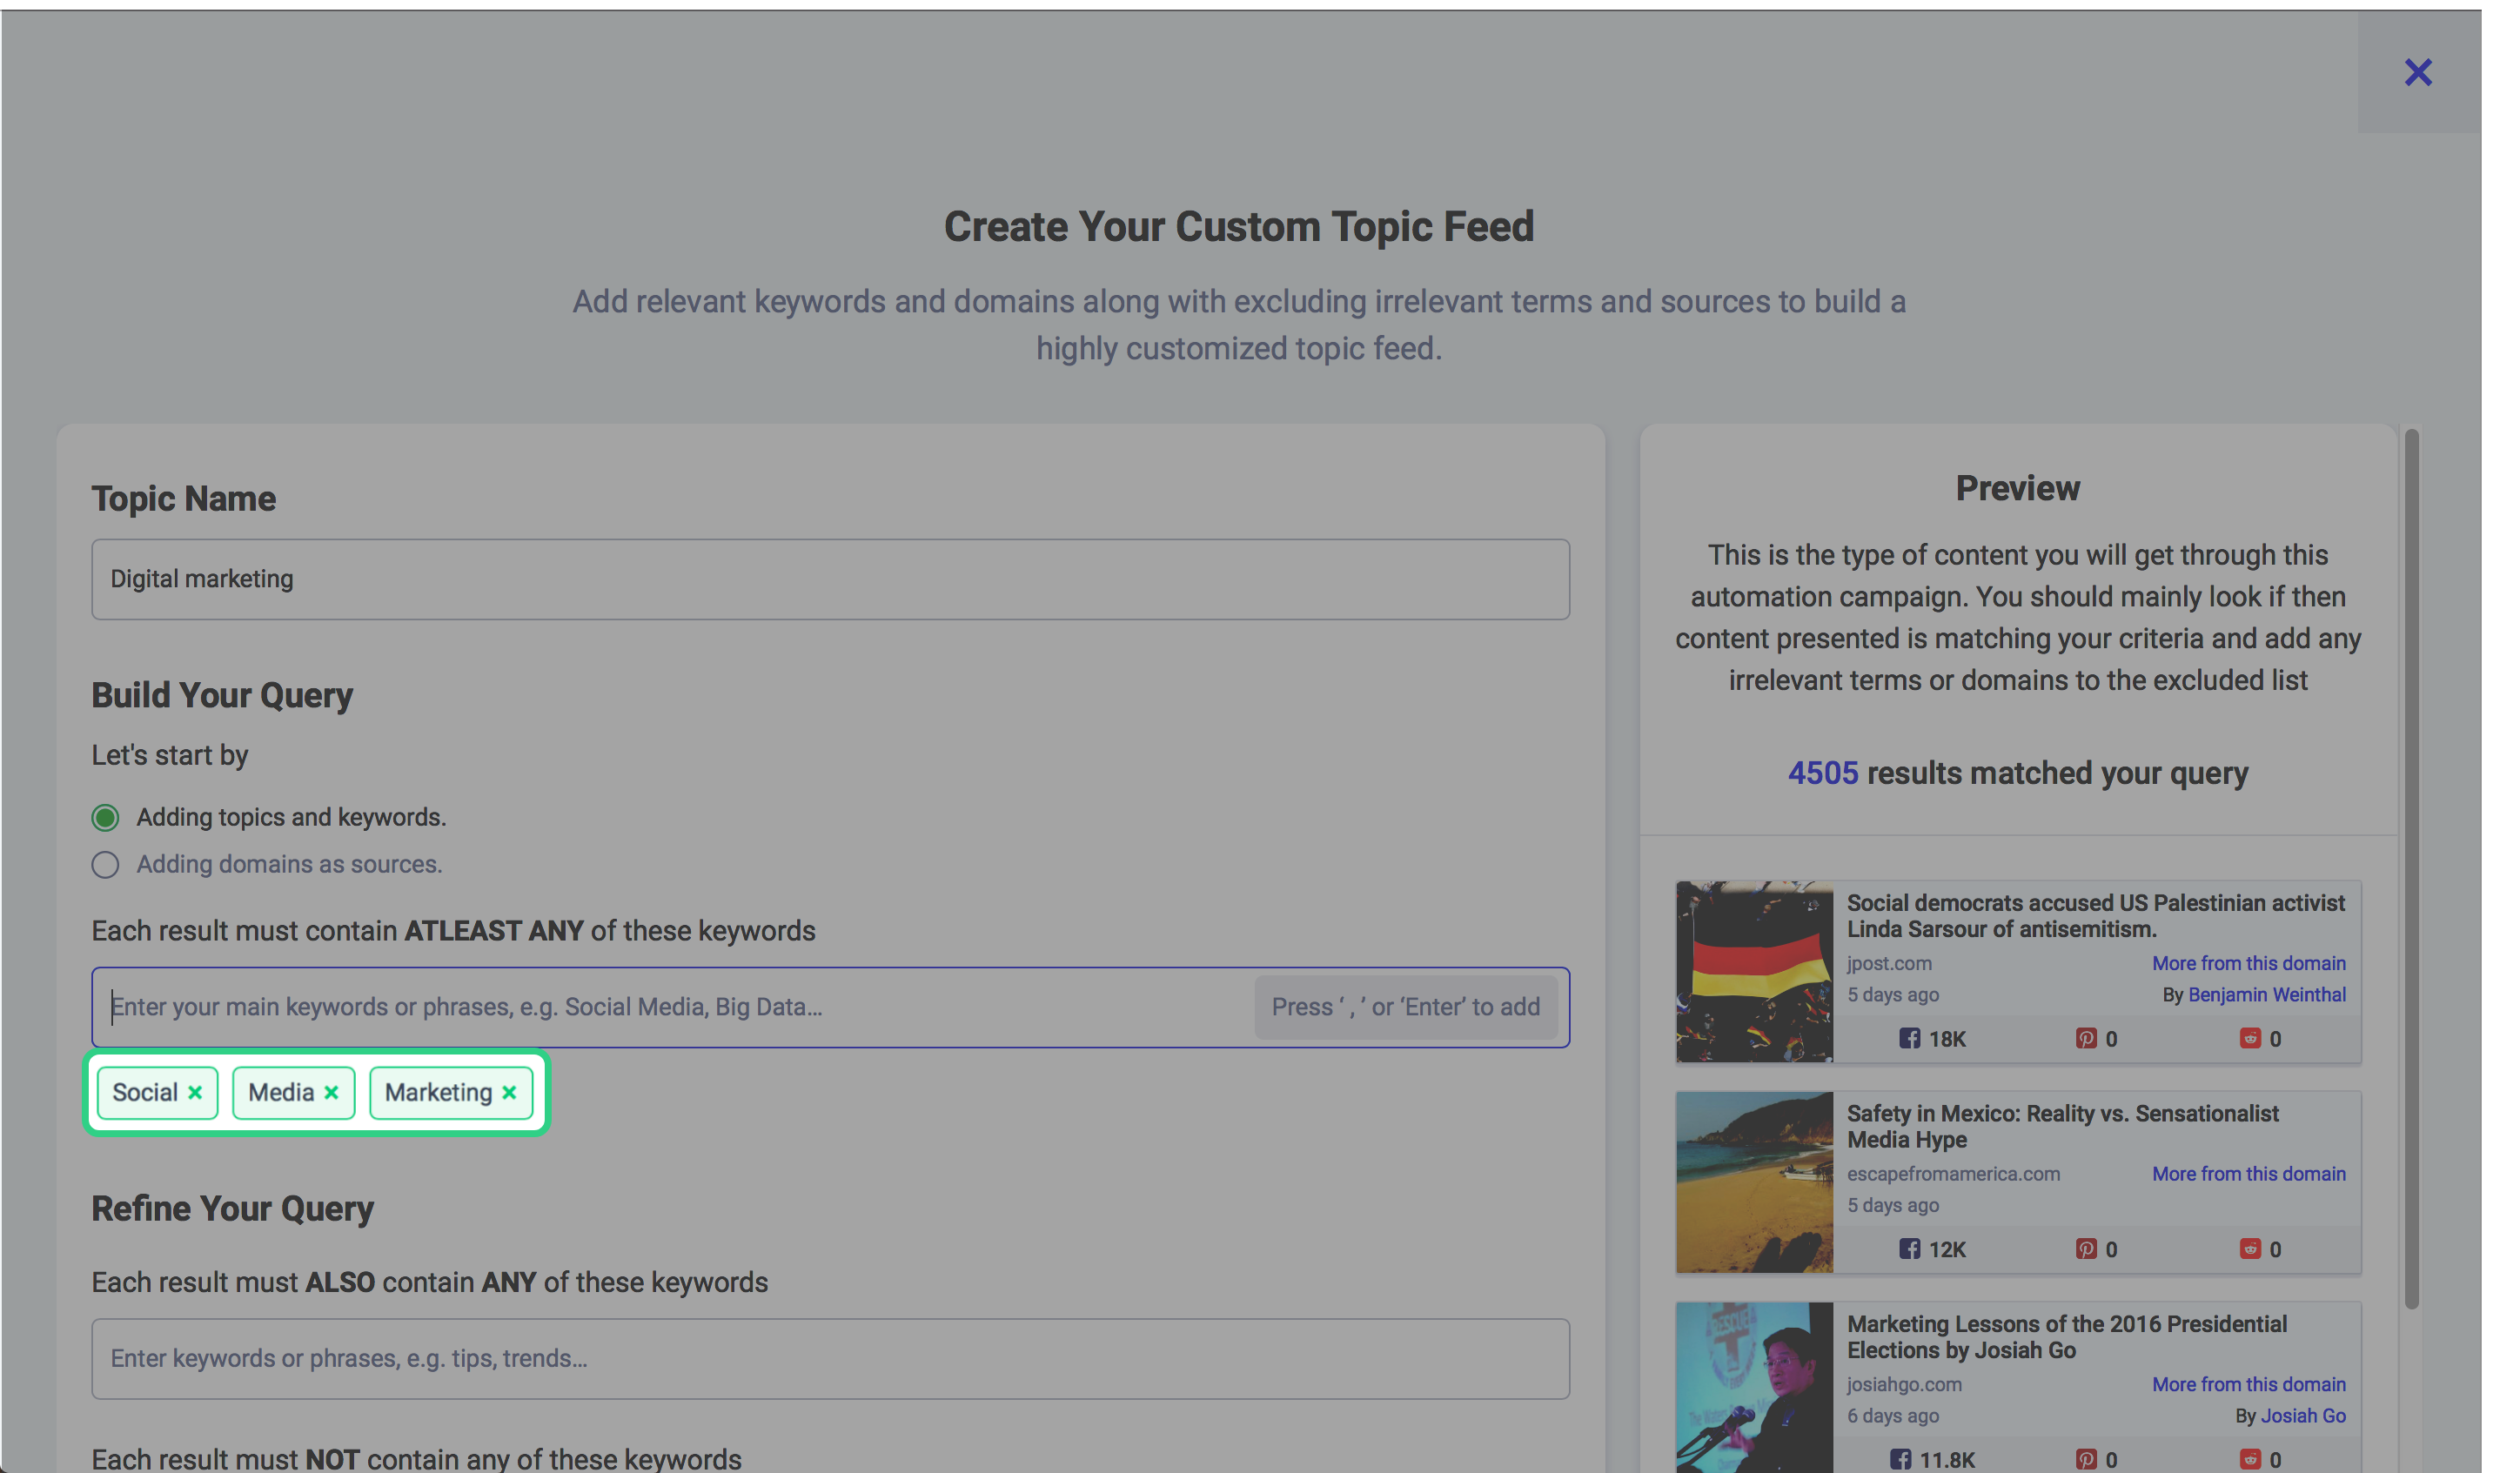
As you can see in the preview section the numbers of matched search results have drastically increased returning almost 5000 articles in the last 30 days. This search pattern will look for any combination of these three words as shown in the table below.
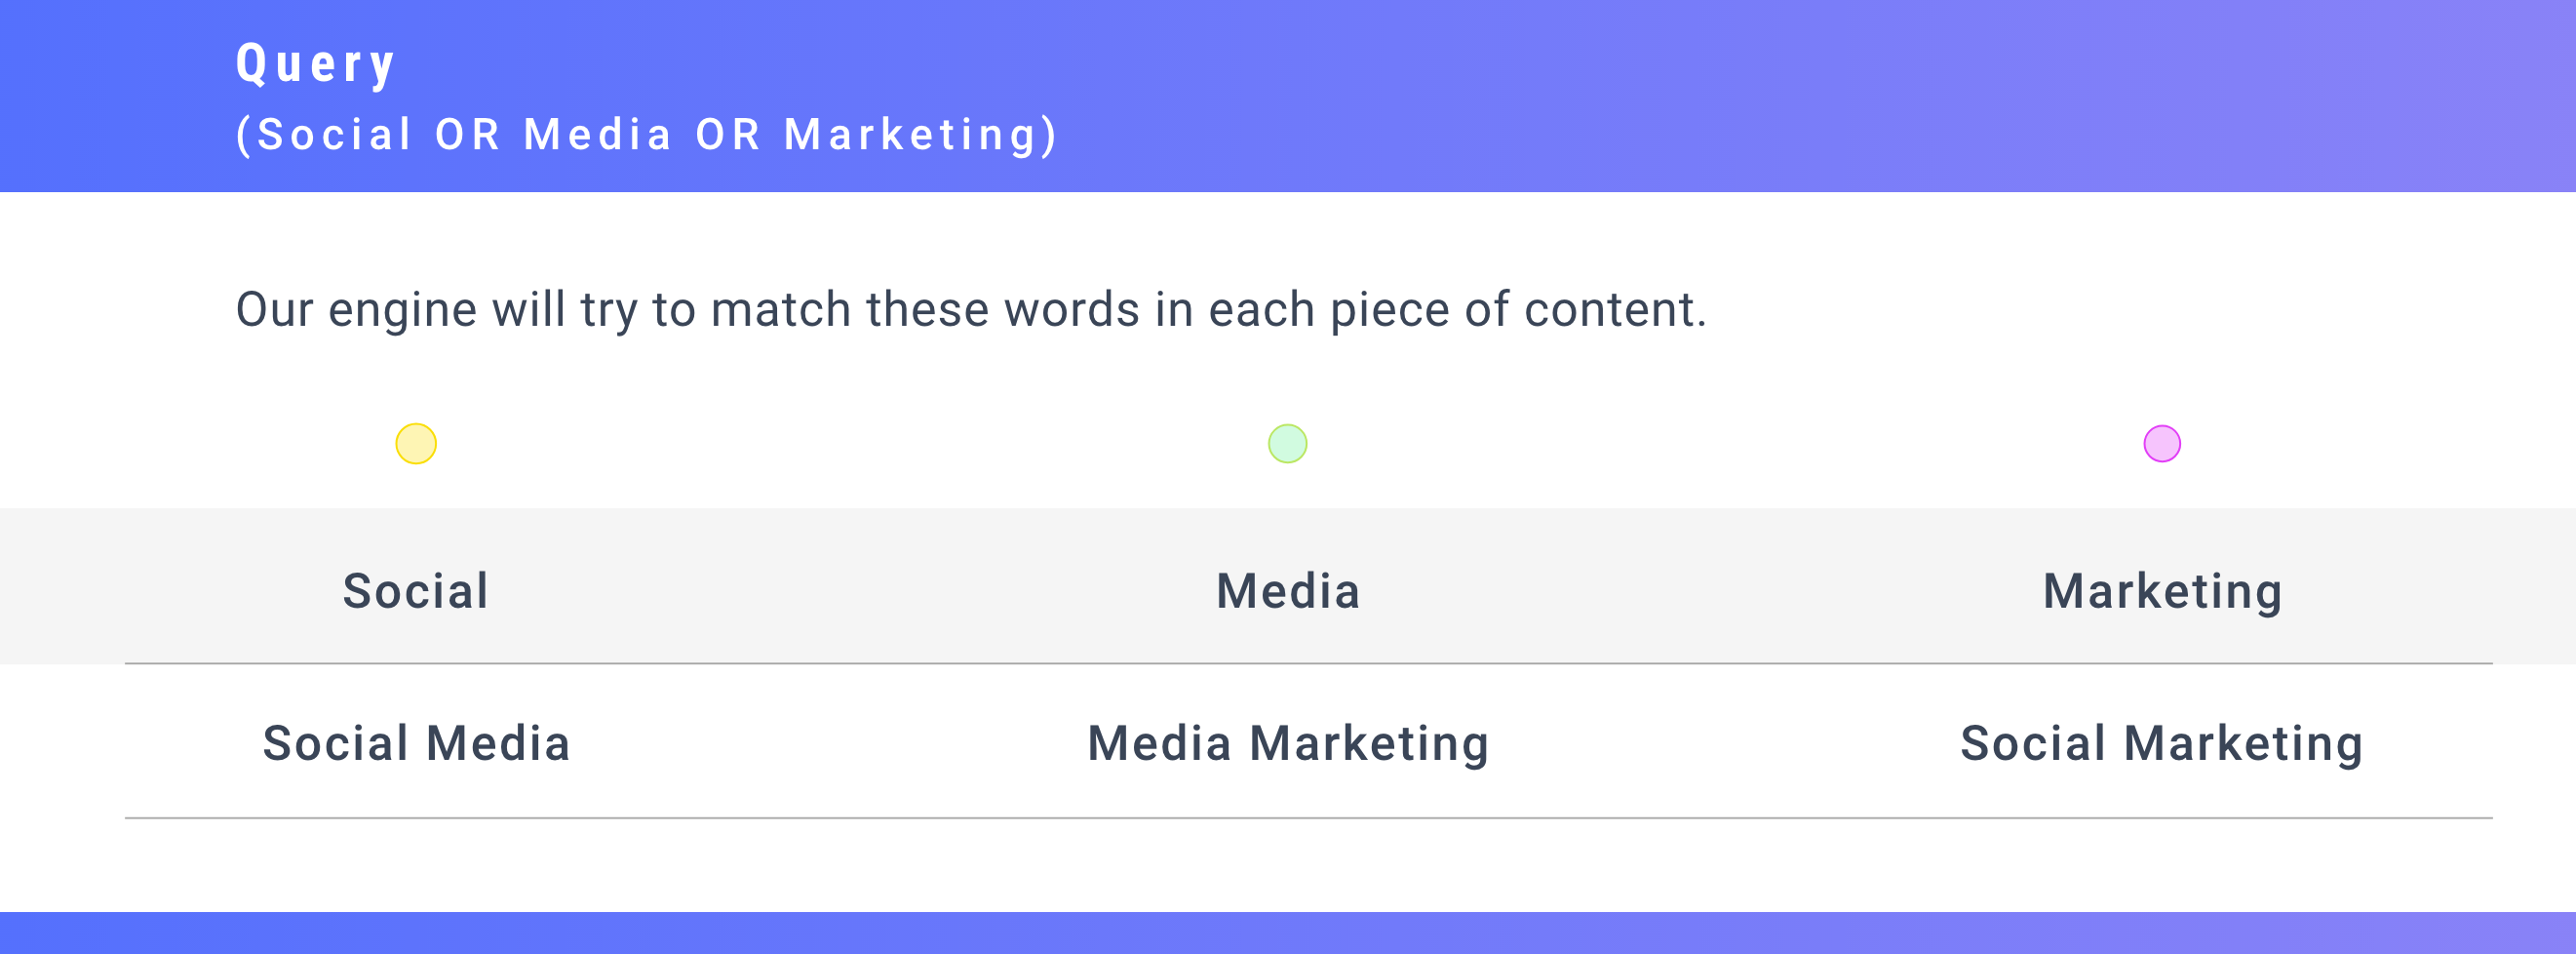
In order to better visualize the search horizon, please see the Venn diagram below.

The problem here is that the terms “Social”, “Media”, and “Marketing” alone are too broad and will give us extremely noisy results that may not be related to our targeted topic “social media marketing”.
Example 3 – Refining results
“Each result MUST ALSO contain at least ONE of these keywords”.
Query: (Social) AND (Media OR Marketing)
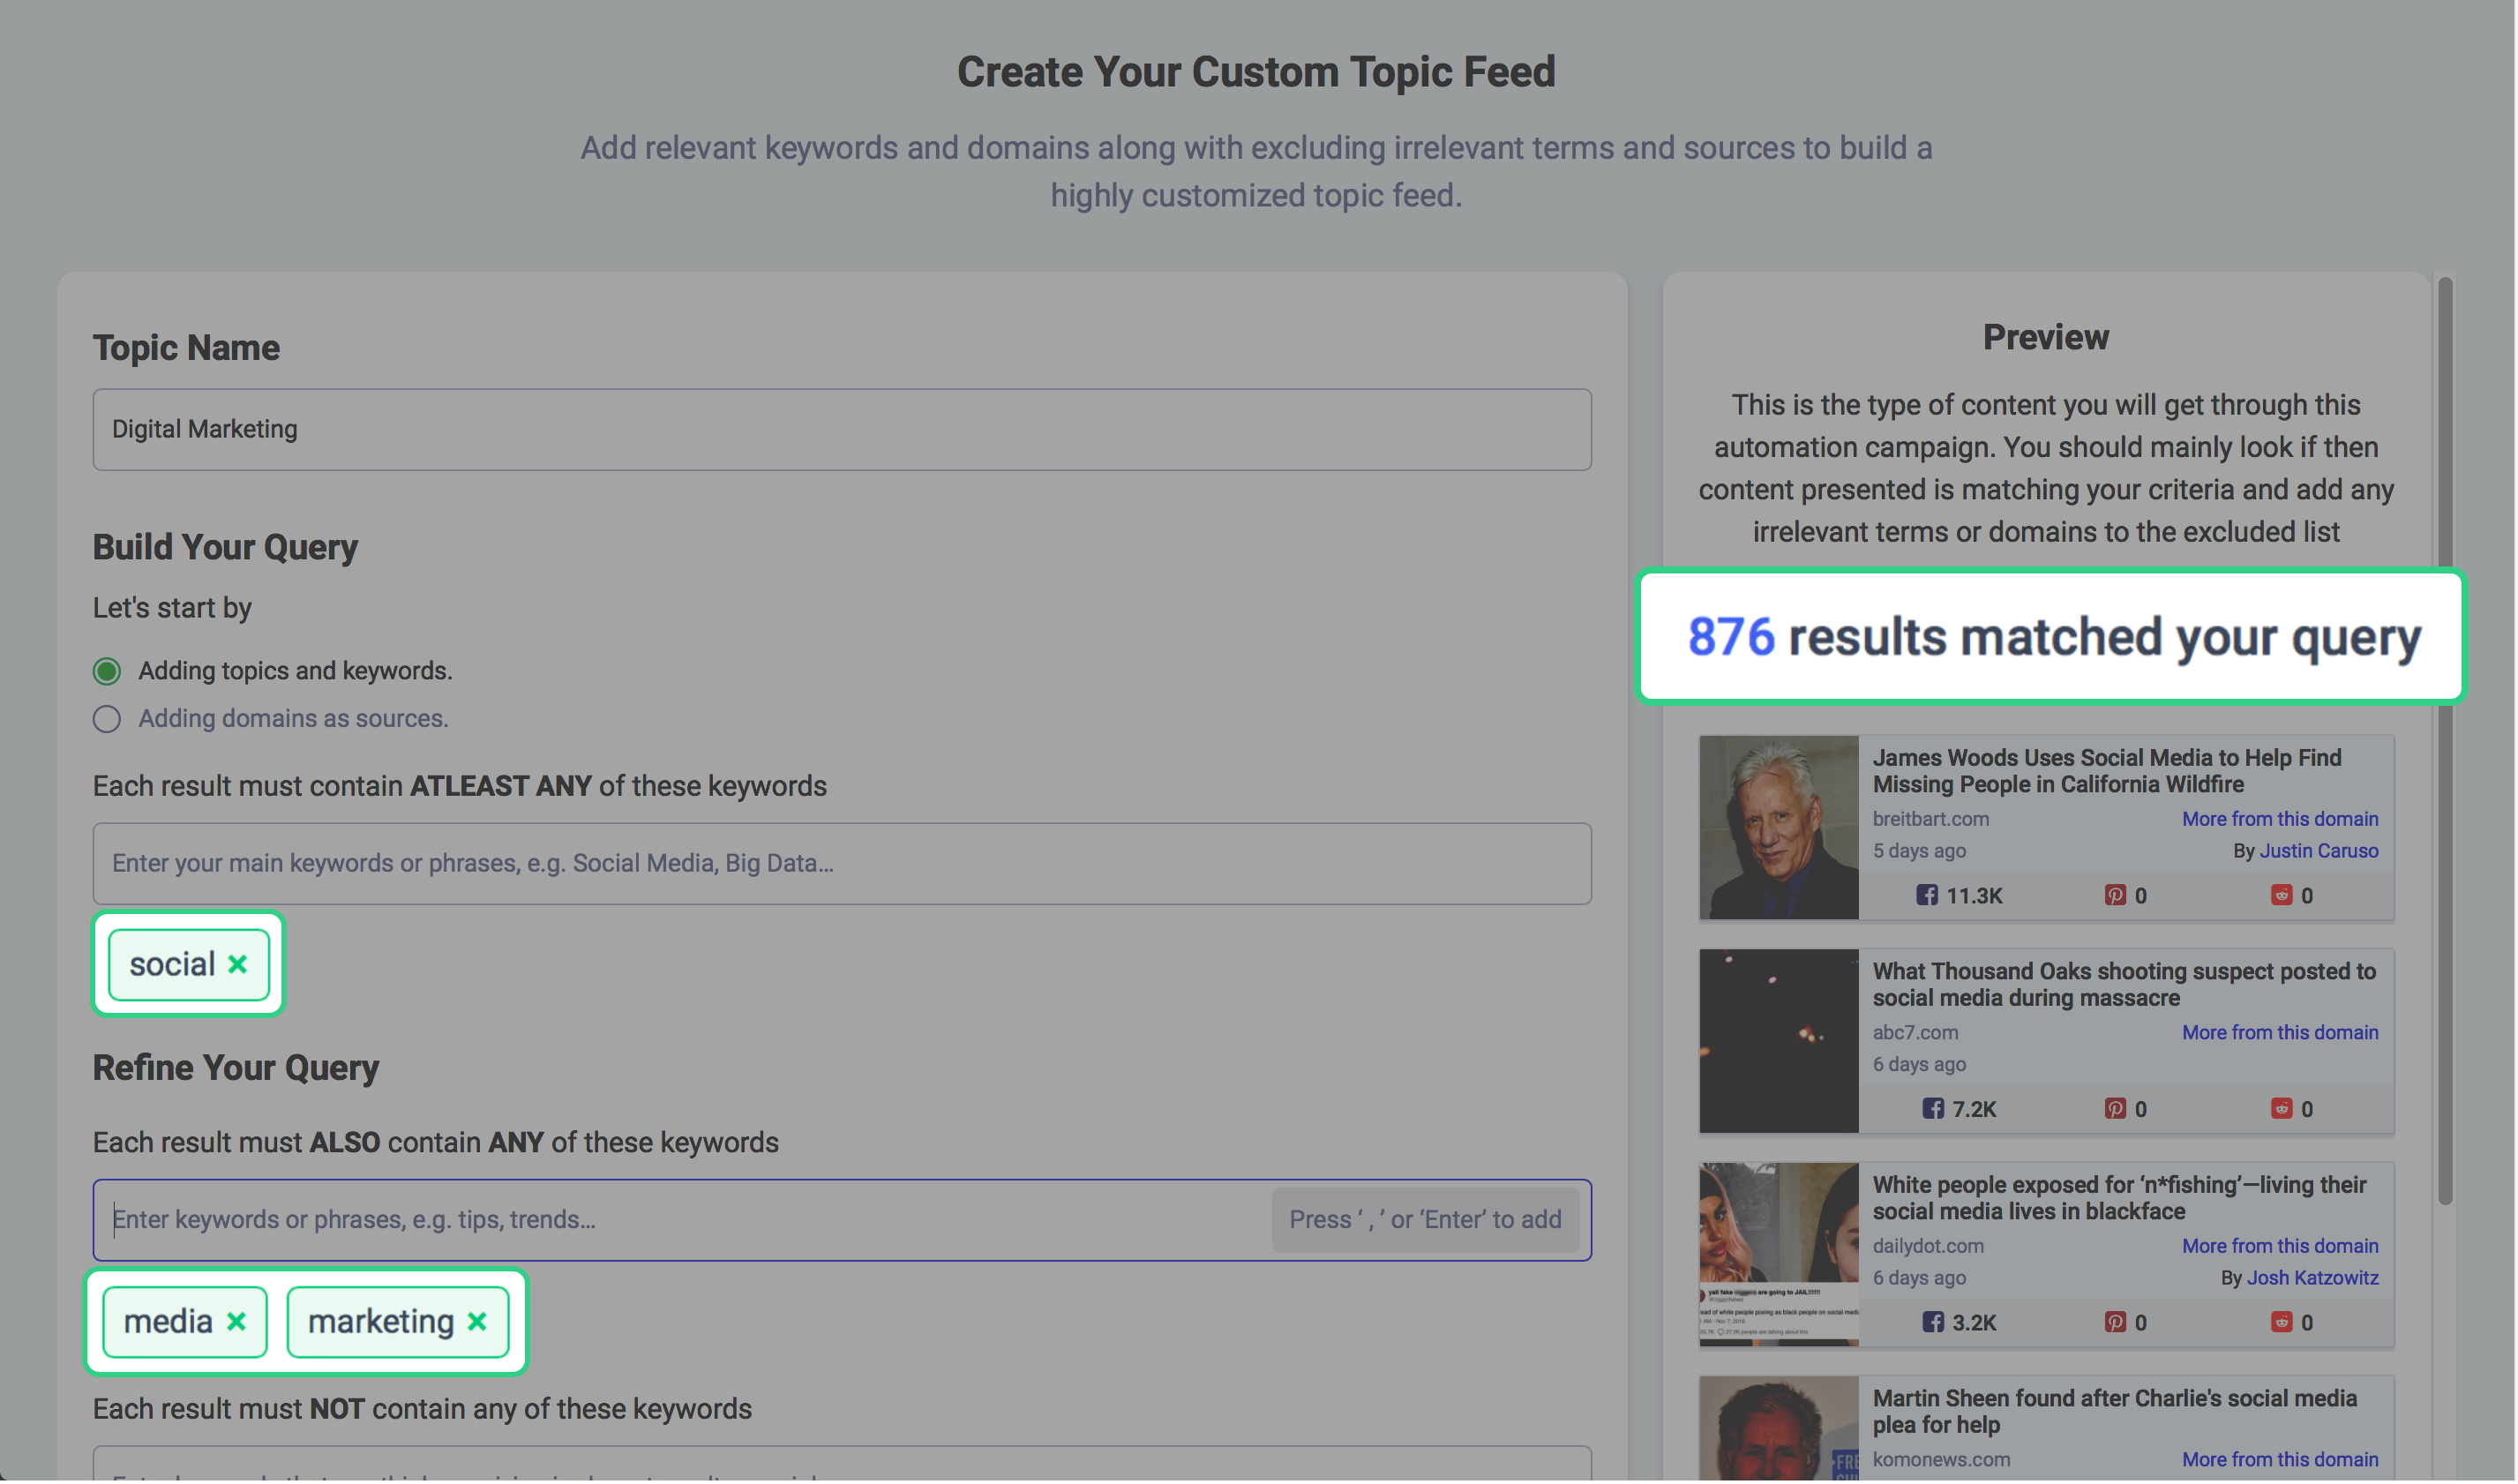
Now results will be restricted to content containing these terms:

Notice how in the preview section only 876 results are returned which is a testament that your search query is now very well refined. The following Venn diagram shows just how only the common areas between the searched keywords are utilized to refine your search.

This method of searching helps you narrow down your search, but at the same time excludes a lot of the content, so be thoughtful in adding terms here.
Example 4 – Excluding irrelevant terms:
Consider the keywords entered in this field as negative keywords. Any article which has these keywords in its title or both title and the body content/description will not be shown in the search results.
Query: (Social) AND (Media OR Marketing) NOT (Job)
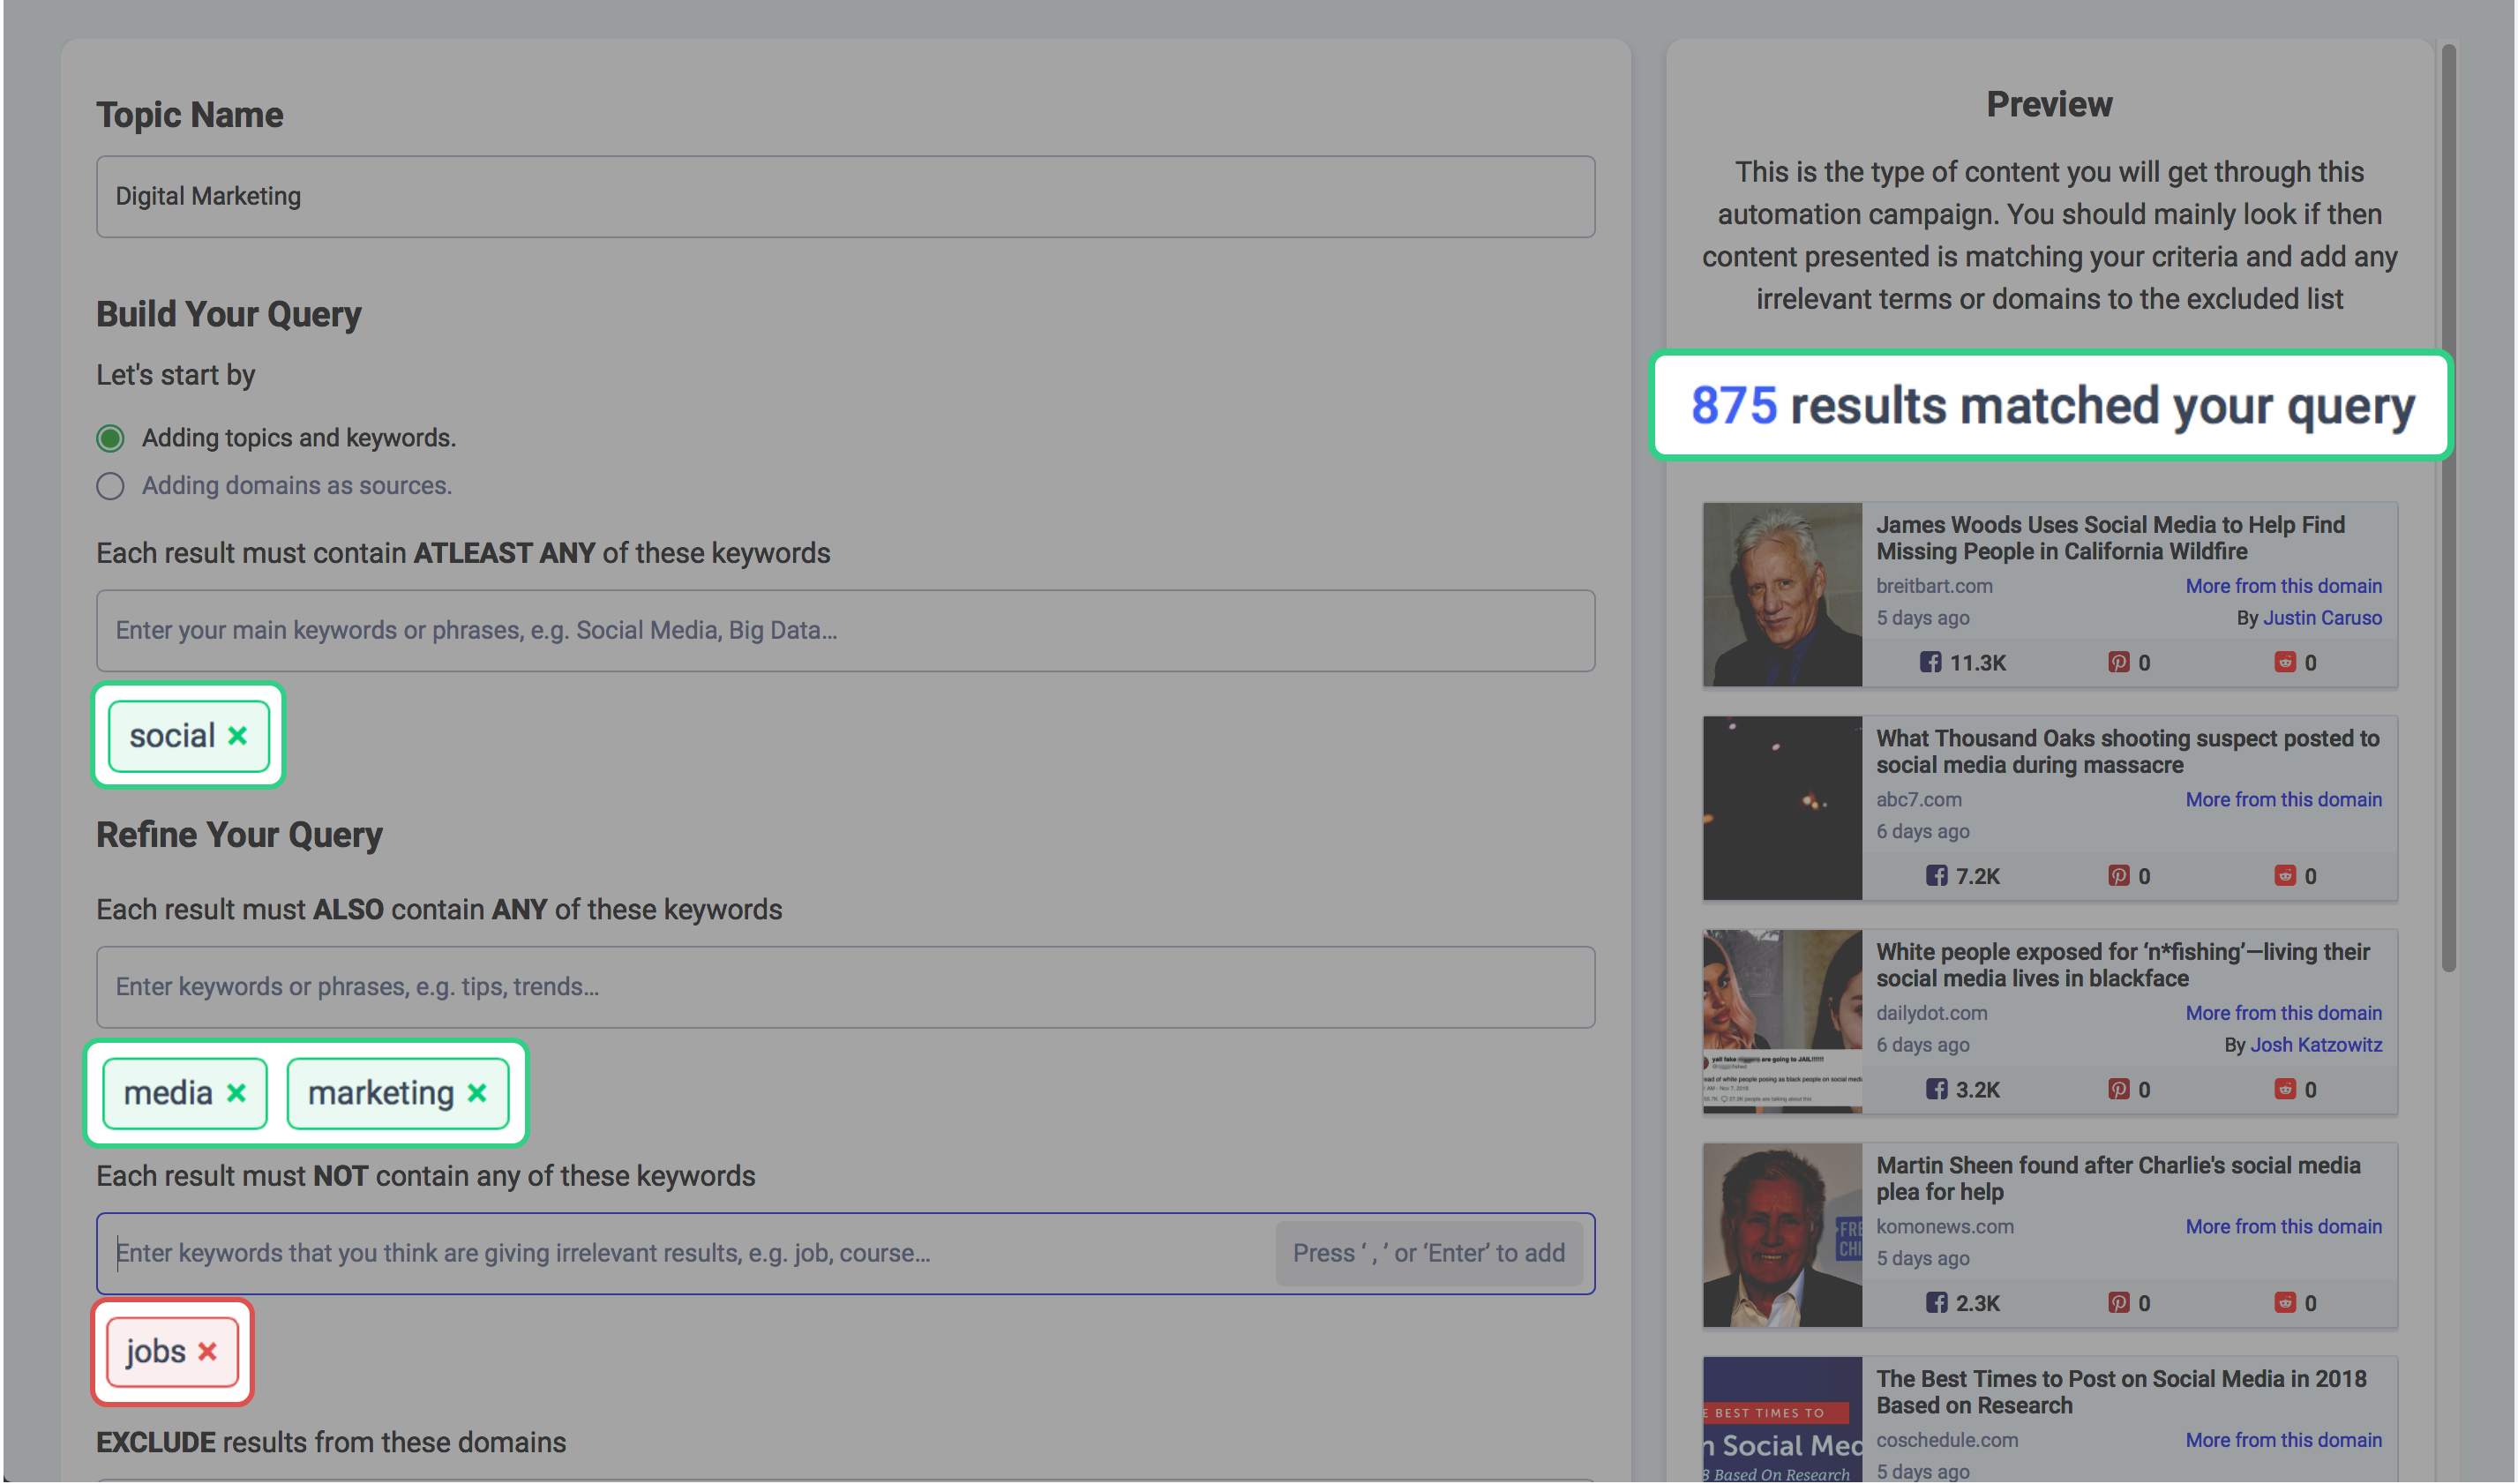
As compared to the previous test case, one result has been omitted which contained the keyword “Jobs”. Now results will be restricted to content containing these terms but if any result out of those contains the word “Job”, it will be excluded as well.

See how the entire area associated with the “jobs” circle has been left out from the returned results and the dotted area has become even smaller.

Combining different search operators we can visualize how your query looks.
Example 5 – Building a bigger but targeted query
If you are looking for volume in terms of search results being shown, use the OR boolean. However, If you want more targeted results absolutely specific to the keywords, use the AND function.
Let us use a combination of all method and visualize how you can search for multiple subjects, saving your precious time.
Query: (“Social media marketing” OR “Content Marketing” OR “Digital Marketing” ) AND (Tips OR Trends OR Strategy OR Tutorials) NOT (Job OR Course)
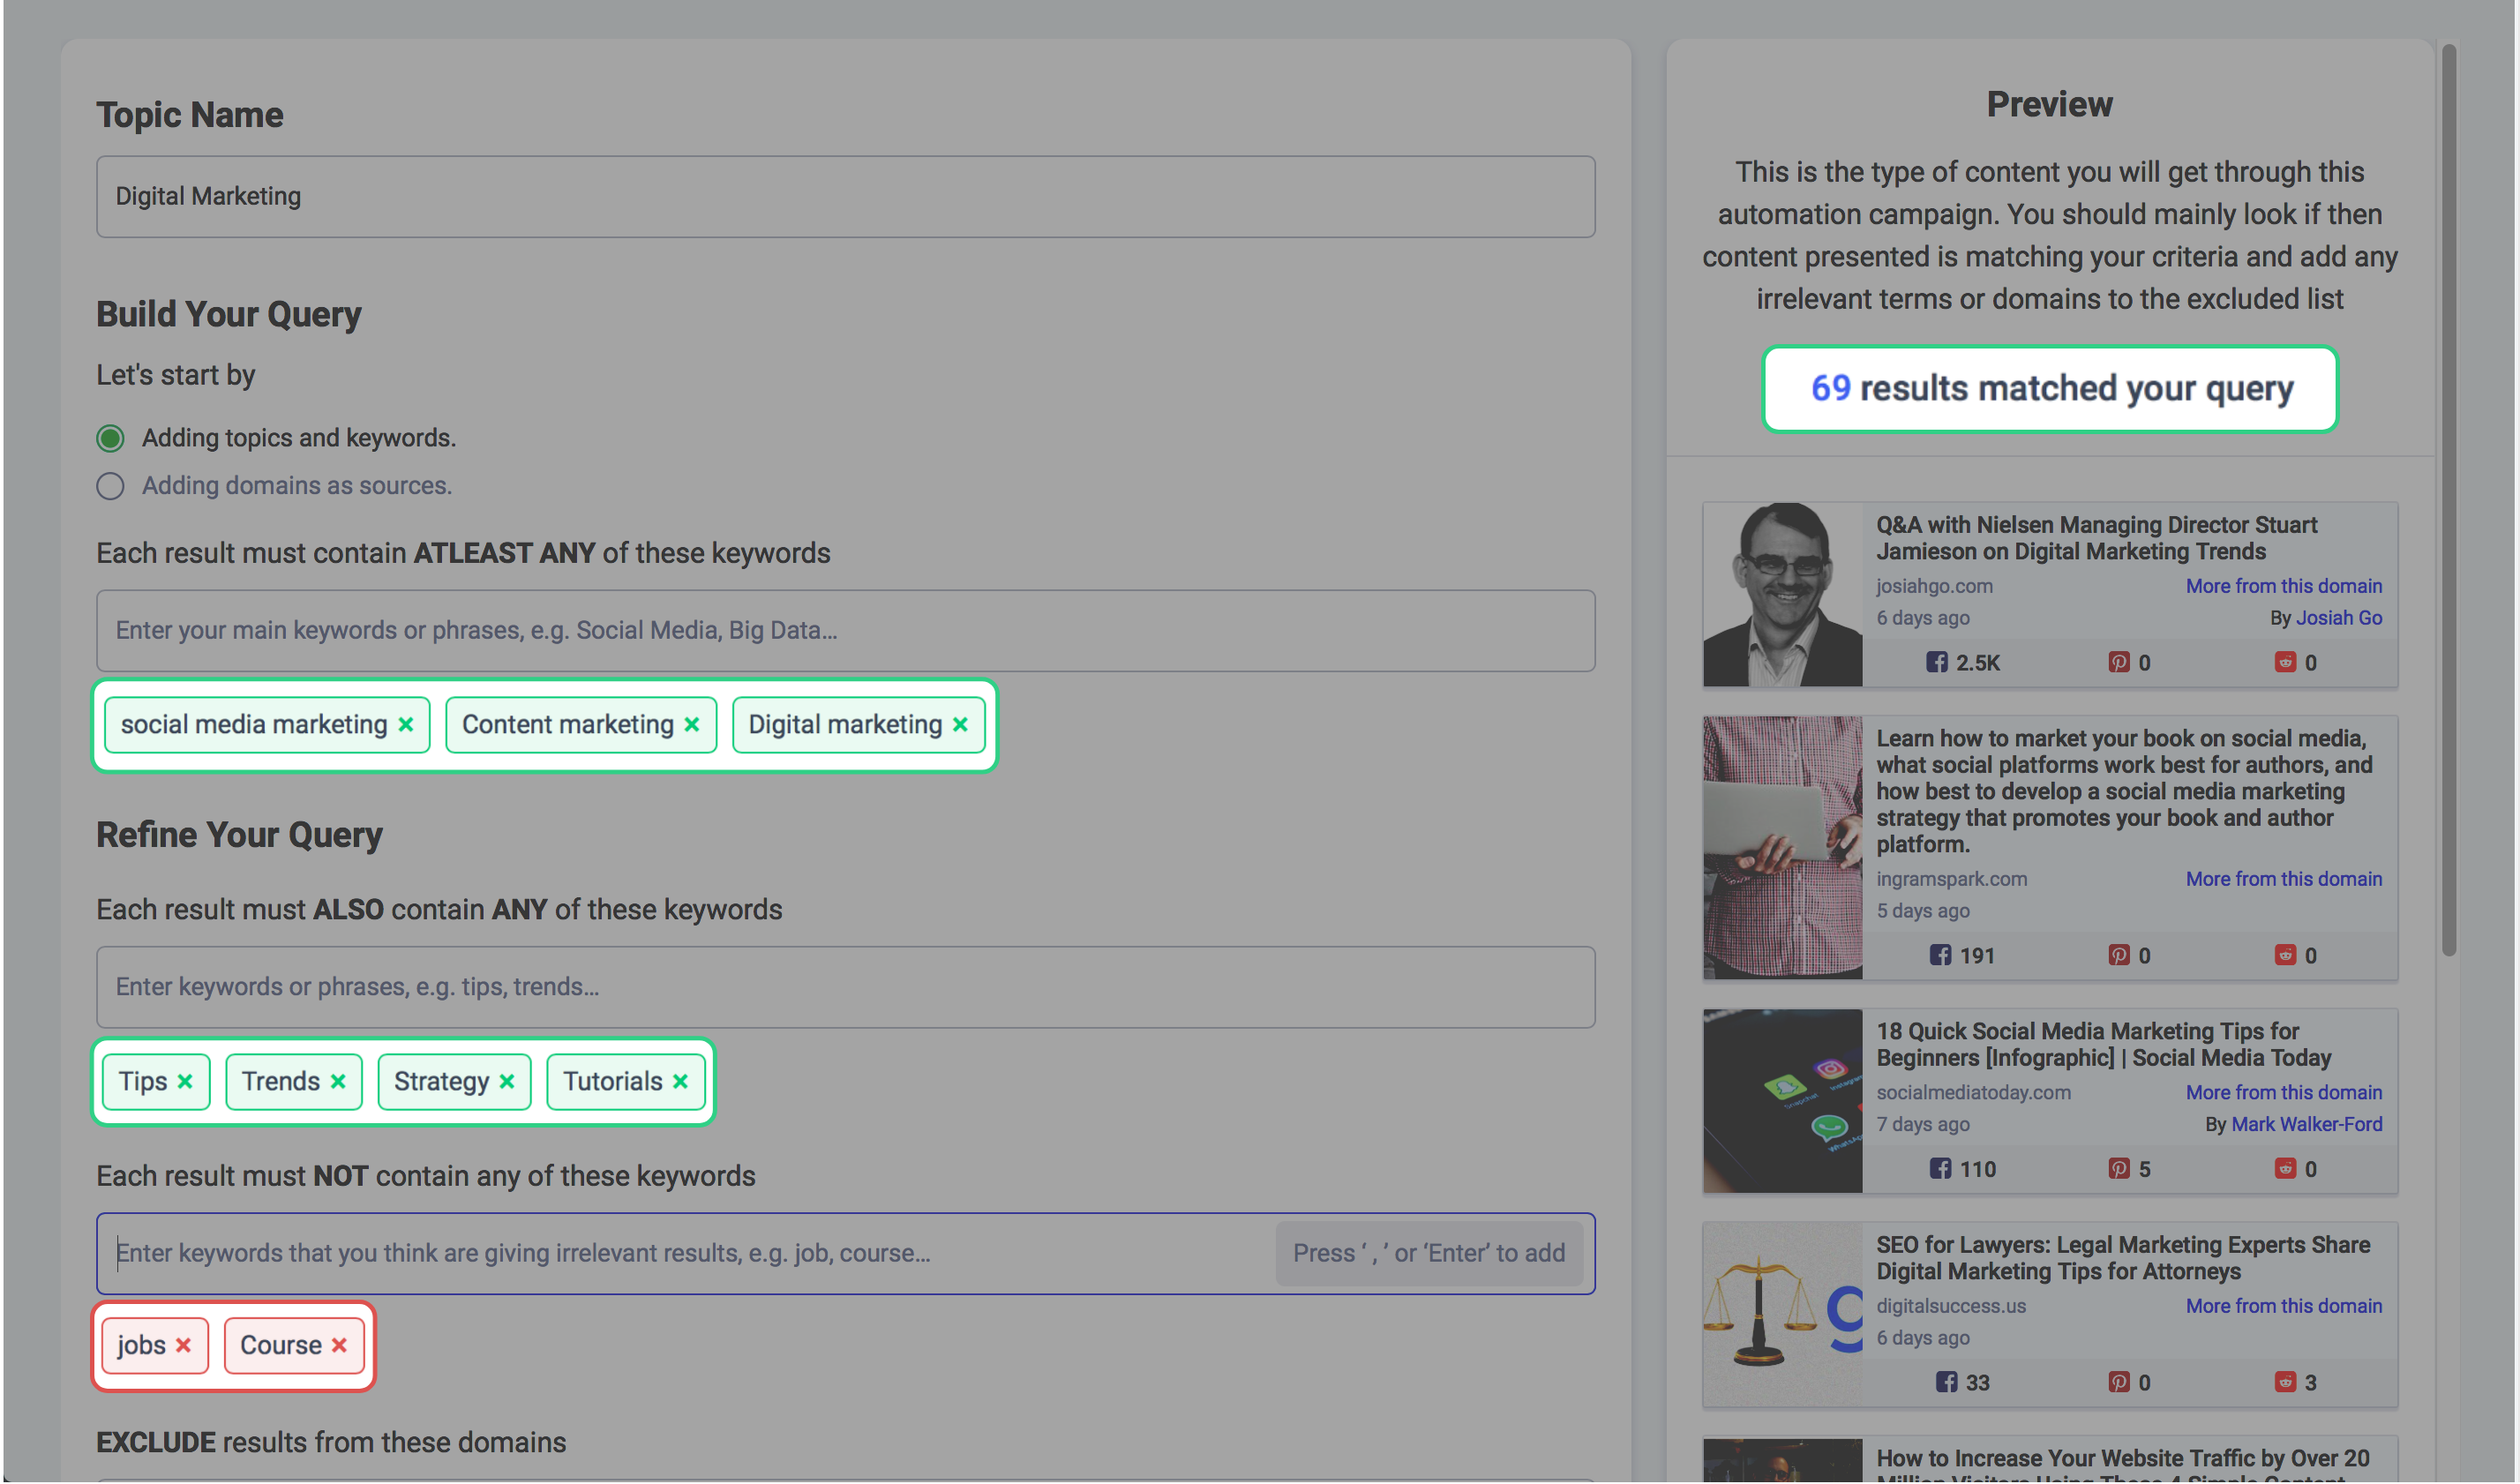
Now, this will cover a much broader range of content but it will be targeted to the type of content we need. Here are some of the possible term matches.
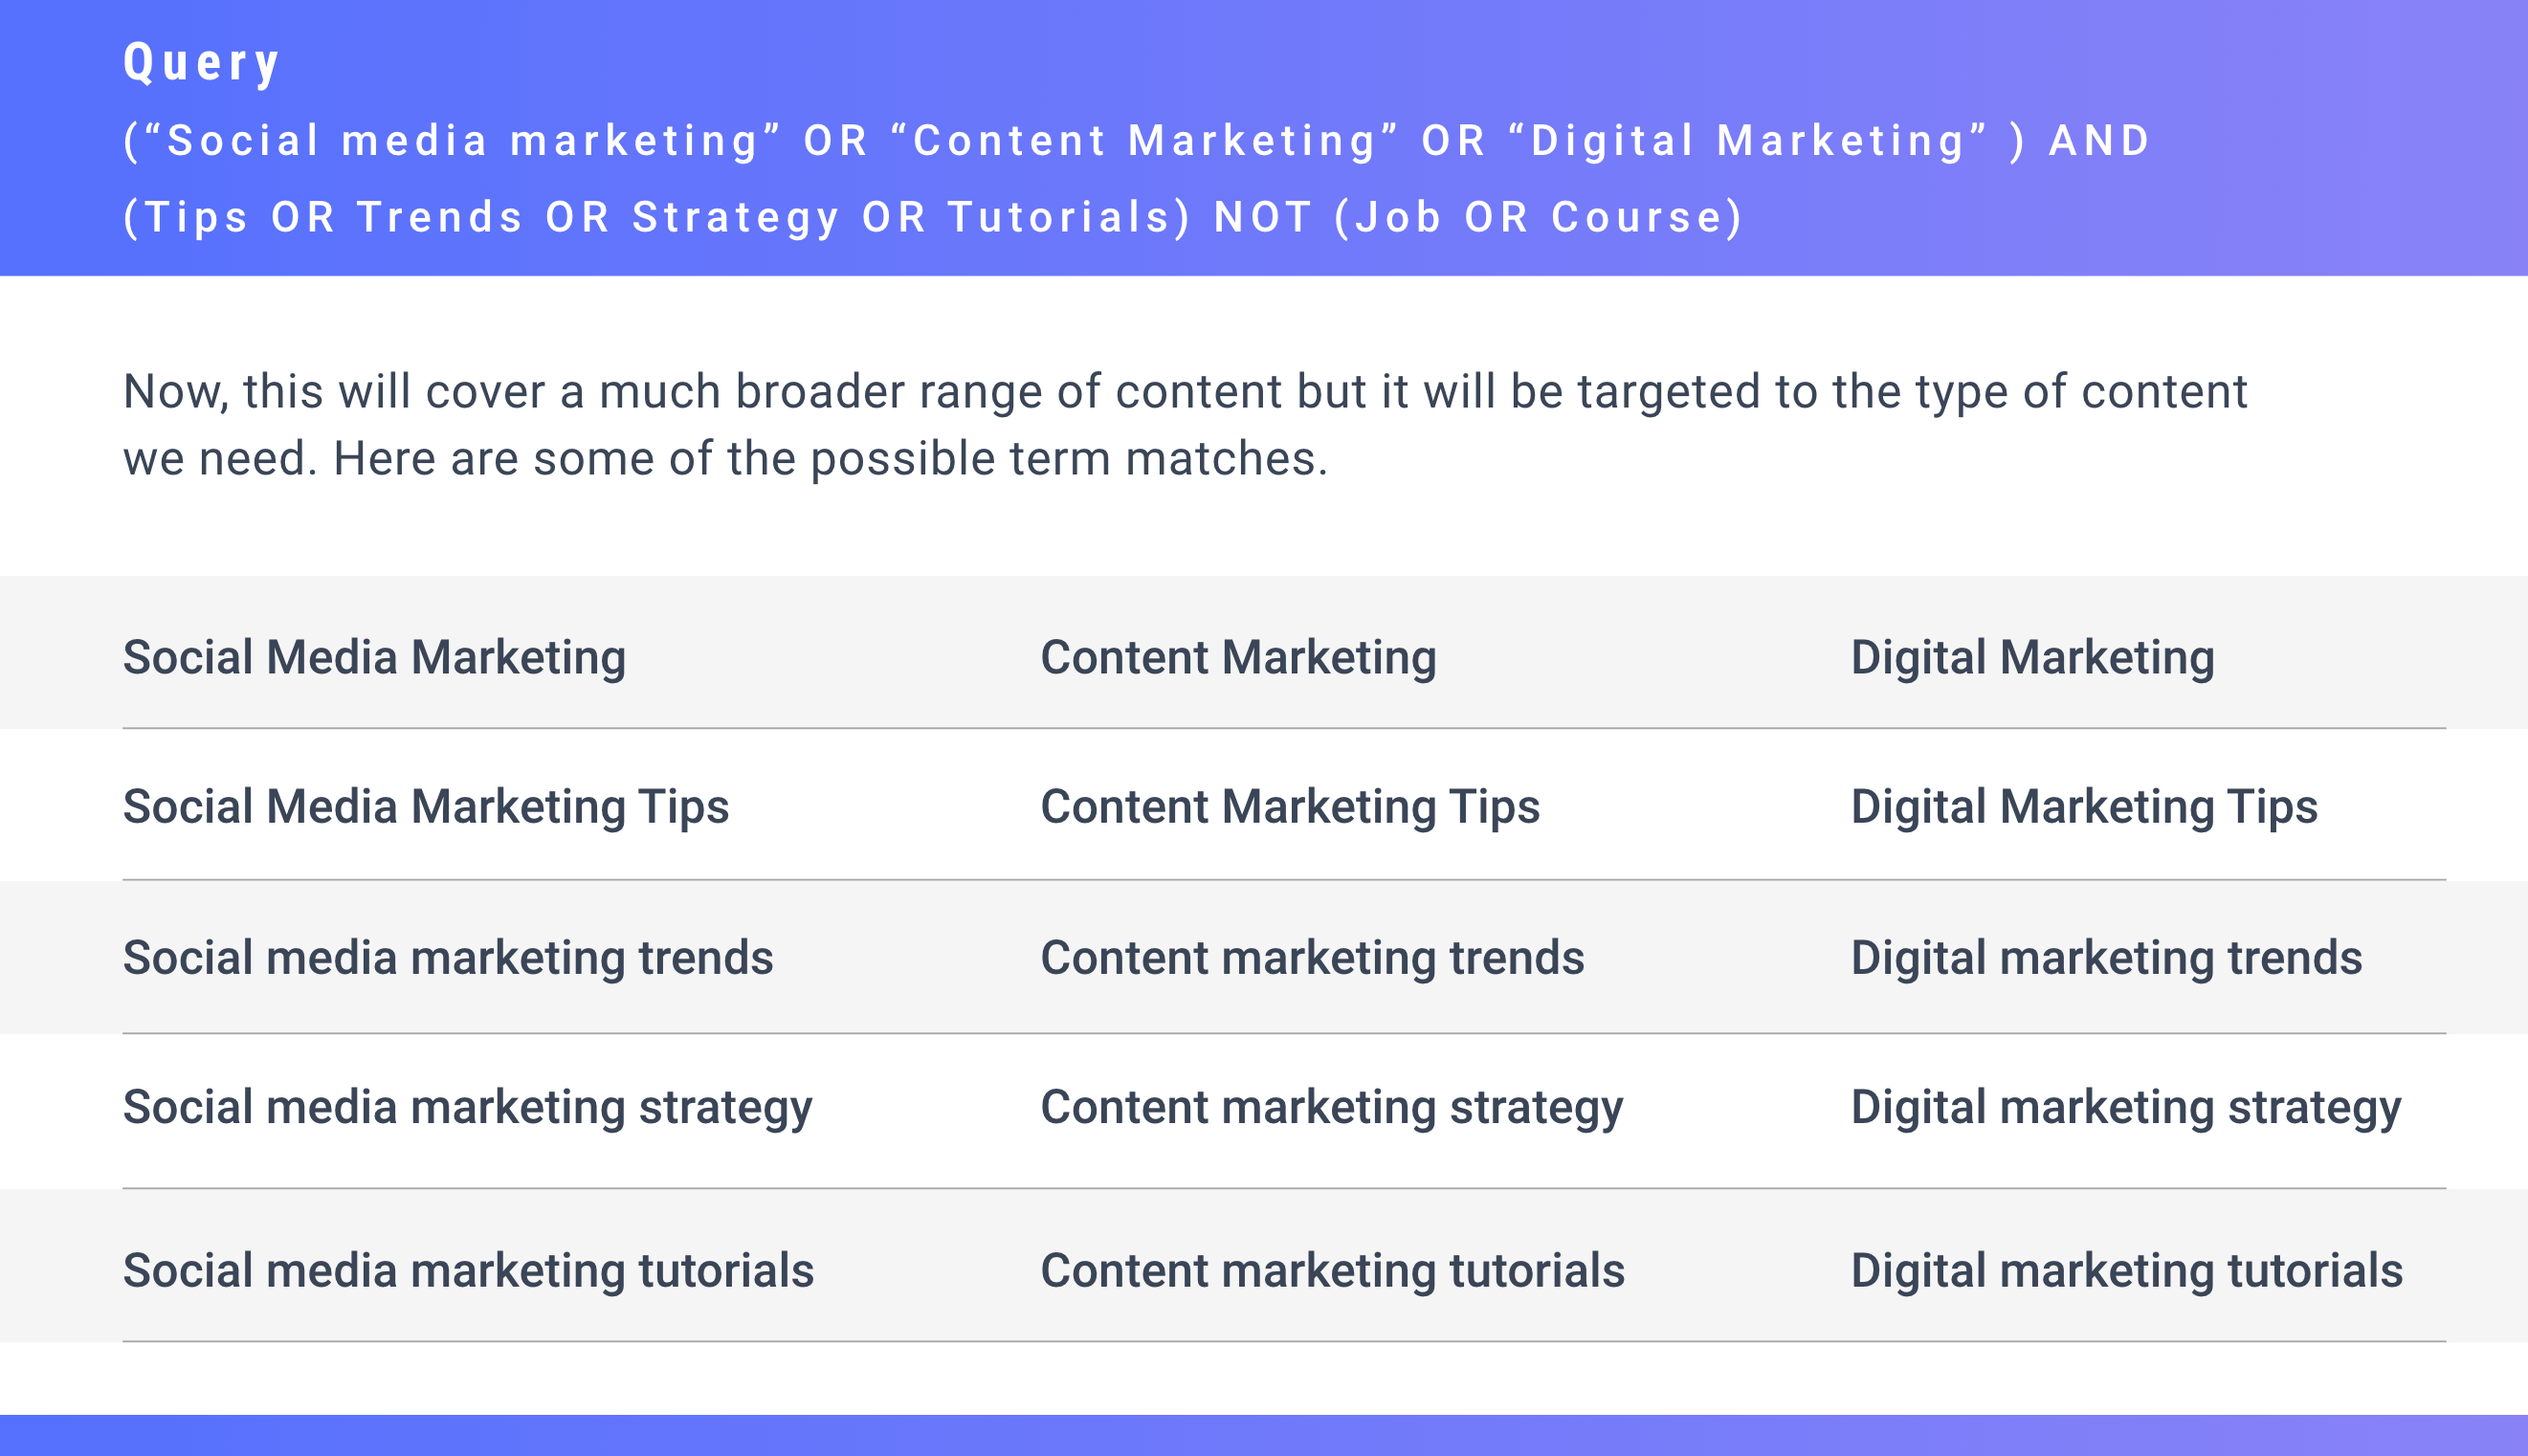
But any result that contains Job or Course will be excluded even if it contains the above keywords.
Example 5 – Excluding domain from search results
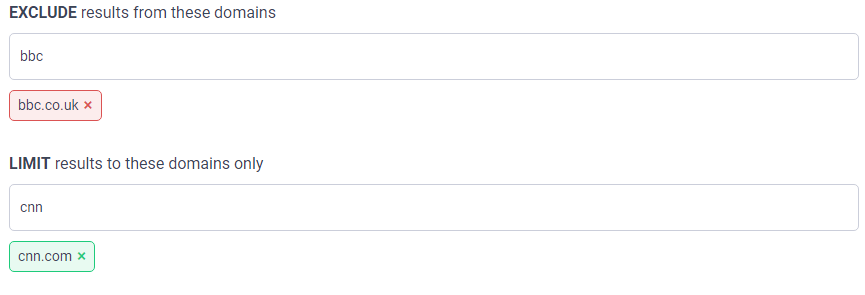
The next search refinement subcategory is the exclusion of certain domains. The statement reads “Exclude results from these domains”.
Even if a certain article fulfills the criteria of the OR, AND and NOT search options, if it is published on the domain you specify in this field, it will never be shown.
A good use of this is to block low-quality content or ill verified news sources.
The final shortlisting subcategory is limiting the search radius to a certain domain. The tagline reads “Limit search to these domains only”. This allows you to see the feed from your favorite sources. Interested in digital marketing, conversion optimization, email marketing or entrepreneurship, add Neil Patel’s blog to your list of domains.
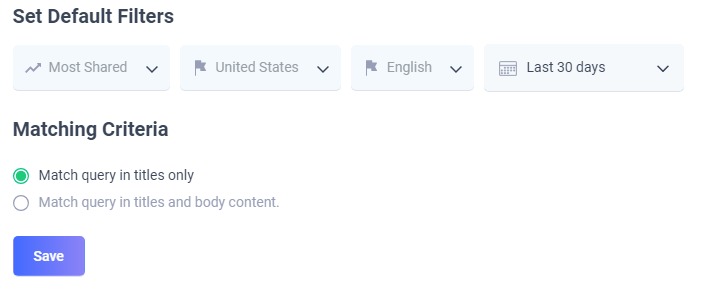
You also have the freedom to set default filters w.r.t social engagement, location/ country, and time range.
Method 2: Adding domain(s) as sources first
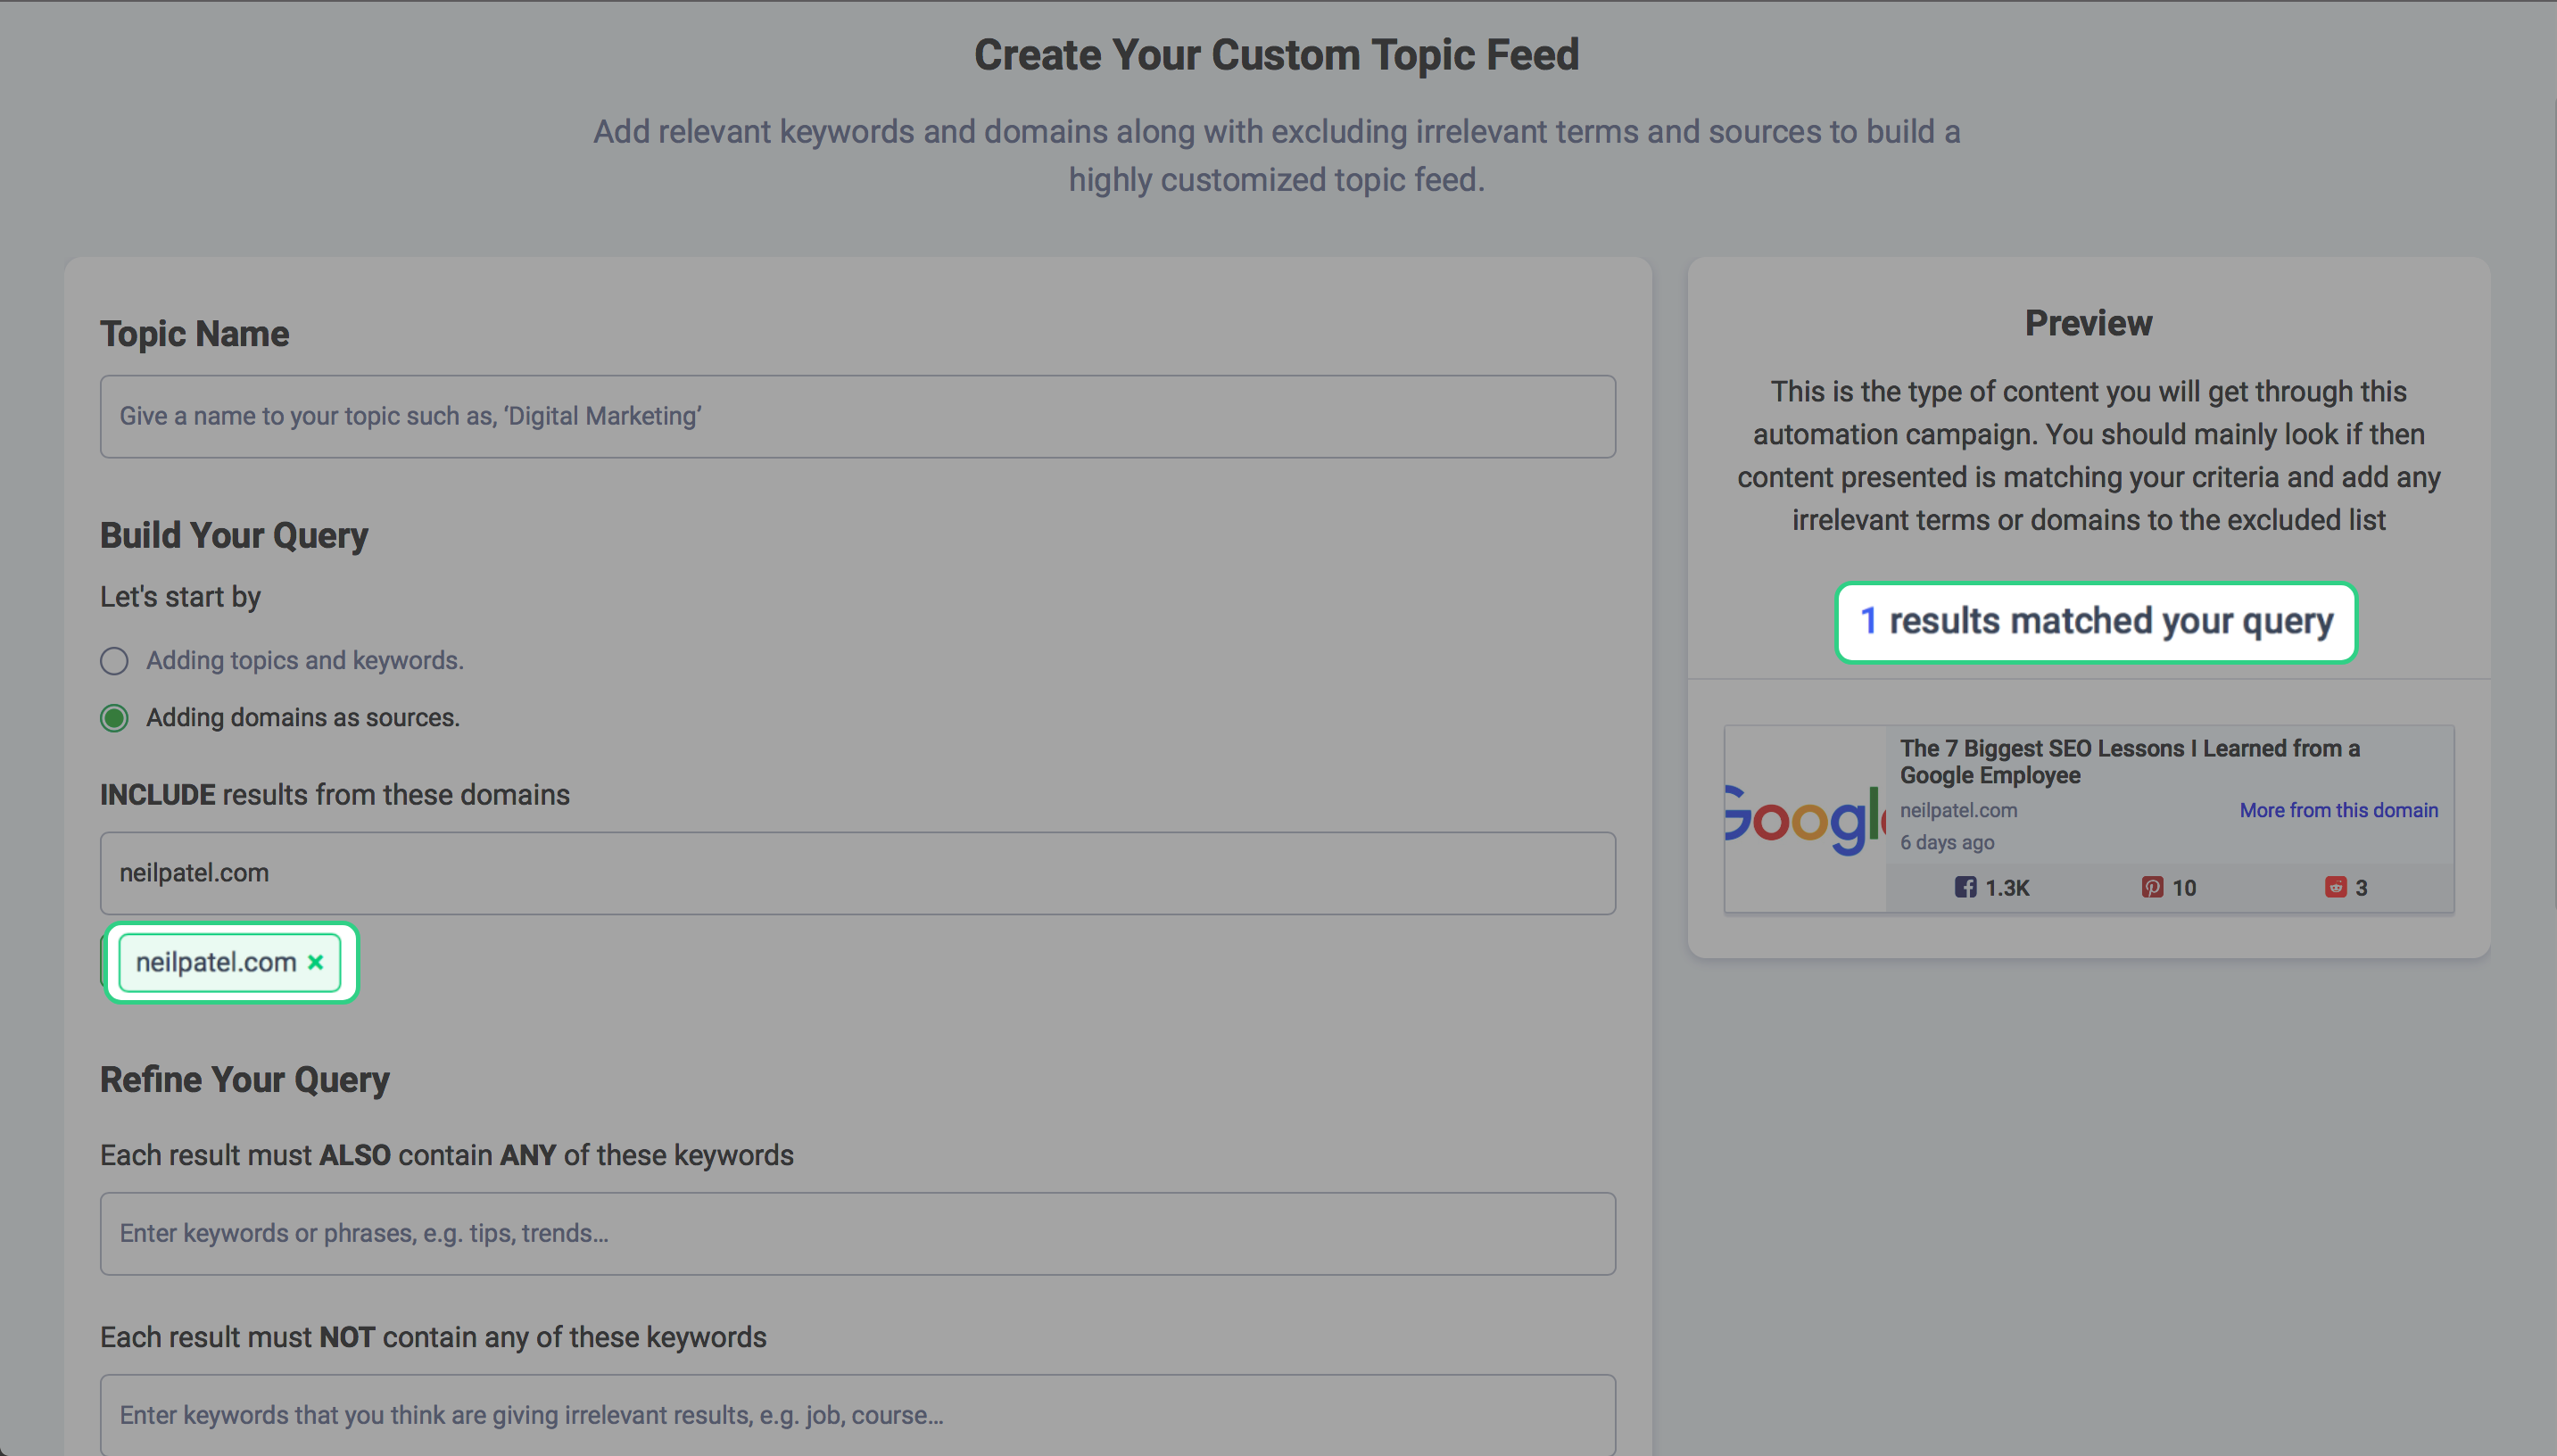
The other way to search for relevant articles across the web and social media channels is to add domains as sources that are relevant to your intended content. In the previous version, this was a separate option and not a part of the query builder.
Integrating this to the query builders provides an easier way to reach your content from specific domains.
The first sub category is including results from user-defined domains. As soon as you add a domain as a source, our system immediately visits the web page and checks for content. This process is repeated every 40 minutes to keep your feed updated with fresh content.
You can also search for an existing domain in the database using the query builder. Add keywords or phrases to build a targeted custom query and add it to your daily content feed. The AND, OR logic in the query builder is the same as that explained in the previous section.
Insights
One of the major updates in Discovery 2.0 is the Insights feature. This supplies you with in-depth statistics of the topics you have created.
The insights consist of refined data ranging from volume, engagement, sentiments etc. that you can use to evaluate the web standing of your categories.
Let us examine them one by one
Overview – Aggregated stats
Topic Analytics provide you with the overall engagement statistics of the whole curated topic. You can select the time period against which you wish to see the statistics e.g. last 24 hours, 48, last month or set custom range.
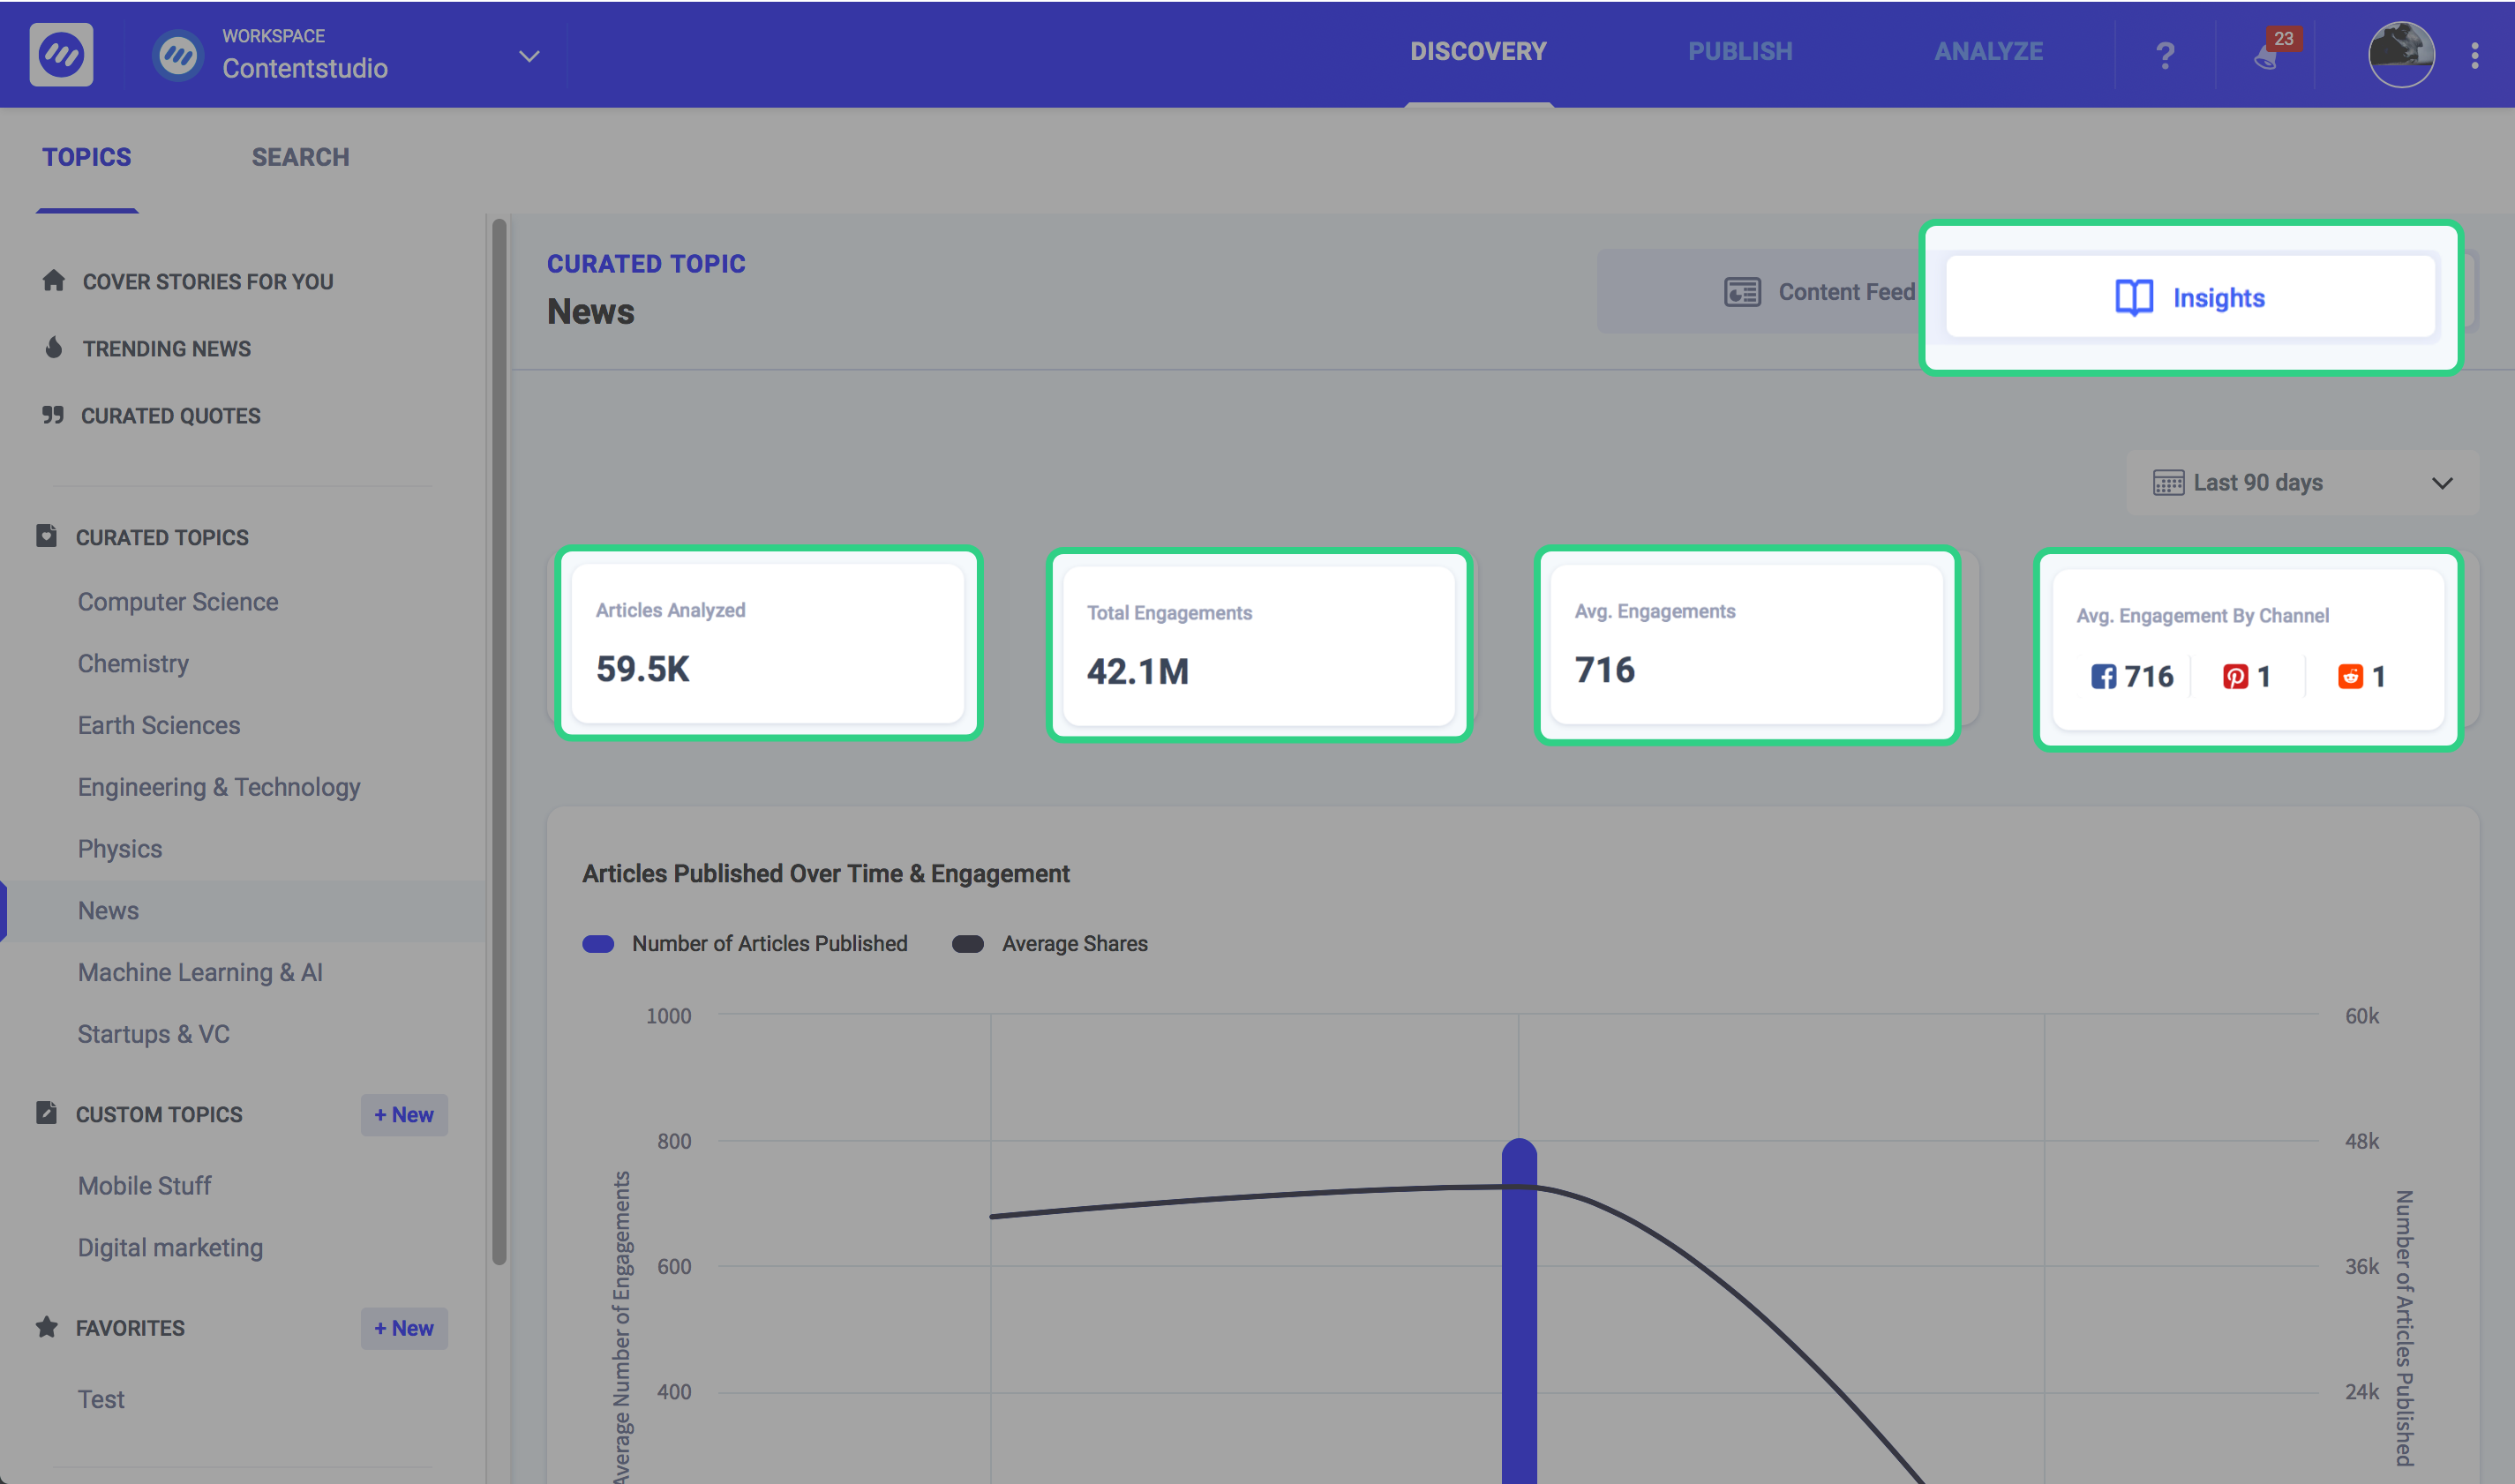
After selecting the time period as per your desire, you can now view data being generated against the following fields
- Articles Analyzed, the Total number of articles found while crawling the Web, Facebook, Youtube, and Twitter for the specific curated topic.
- Total Engagement, this figure is the combined number of engagement for all the articles found *a particular topic put together. This gives you an overall sense of how popular a topic is.
- Average Engagement, it is the average number of shares for each article on the topic. Calculate by dividing total engagement by number of articles
Average engagement by channel.
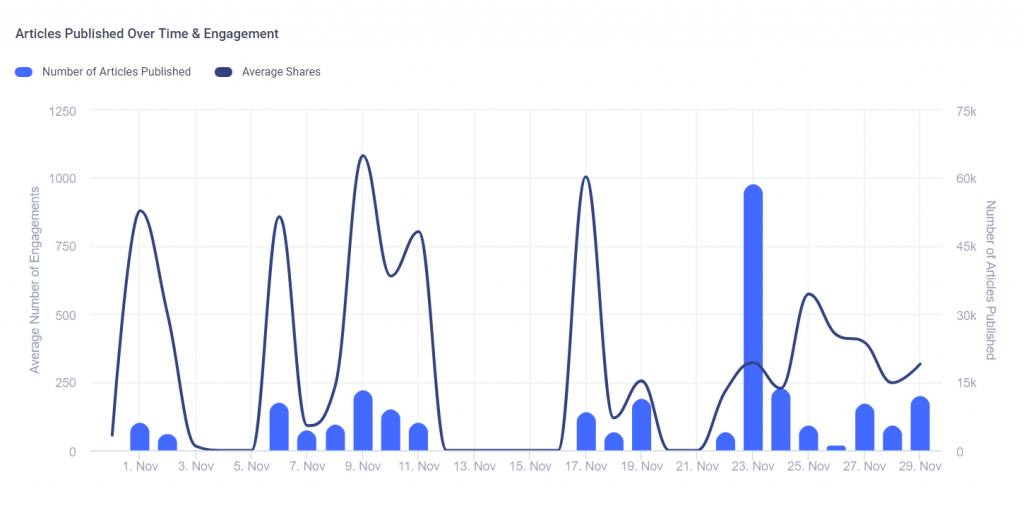
Articles Published Over Time & Engagement
This graph shows the total number of articles published over a specific period of time. Analyzing the image below you can visualize how the popularity of a topic has progressed with time.
Sentiment Analysis w.r.t Time
Sentiment analysis through its sophisticated algorithms predicts the tone of an article whether it is positive, negative or neutral. This information is accumulated for all the articles for a topic and displayed in a colorful graph against time.
The sentiment category of an individual article would remain the same. However, the number of articles being published under individual topic might make the graph go up and down.
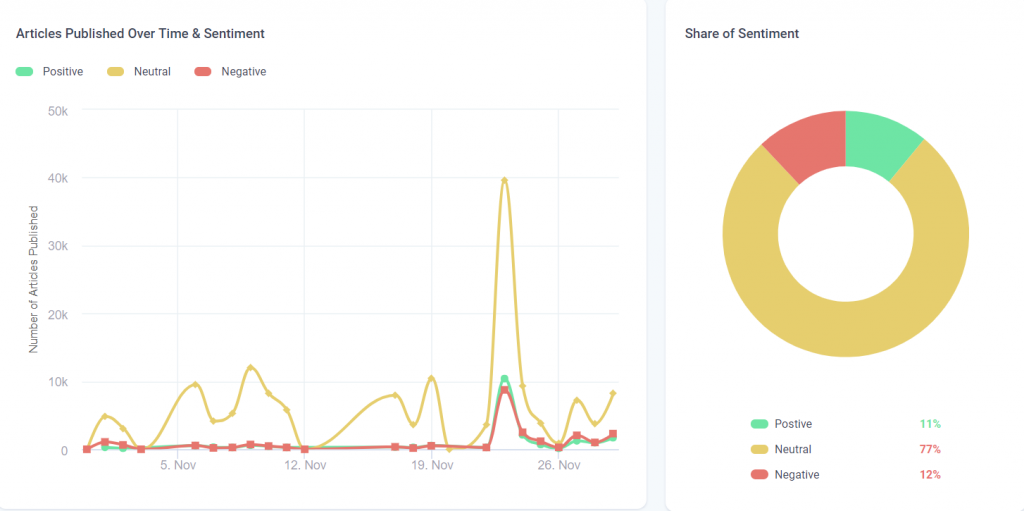
If negative articles are being published, overtime the graph will go down. On the other side, if positive articles are being produced, the sentiment graph of that topic will go up.
Engagement by Network
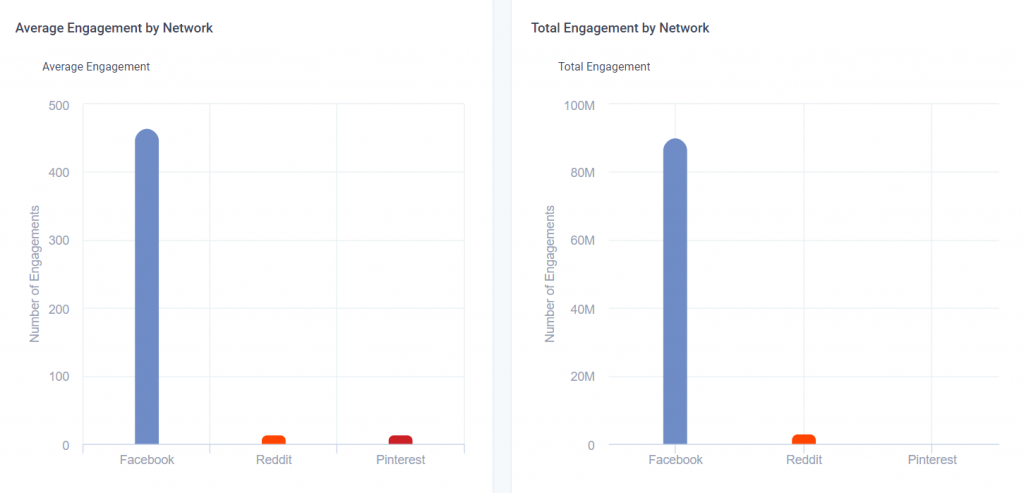
This section allows you to pinpoint which topics are trending on which social media platform. A topic might be gaining popularity on Facebook and at the same time doing not so good on Twitter.
This variation is elegantly shown in two graphs. Average engagement by a network and total engagement w.r.t network.
Average engagement is the total engagement of all articles pertaining to a topic divided by the number of articles.
Popular Content Types
This section in Insights shows you what type of content is popular on the web. The types we have selected are articles, content with “how to”, video content, reviews, listicles e.g. 6 Tips to Turn Your Employees into Social Media Advocates, Doubling the size of your Followers and podcasts like Gary Vaynerchuk.
This graph illustrates both average engagement per content type and the total number of content items by type.

Popular Word Count
Knowing the length of articles/ content that are trending shows you what length are to post on which medium. It will also help the content writer and content marketers to write and promote appropriate length articles.
The word count is displayed against average engagement per content. So not only you get the popular word count, you get it against popular content as well.
Being updated on what length popular content creators are producing can help you follow in their footsteps. Content length would also vary from topic to topic.

Popular Reading Levels
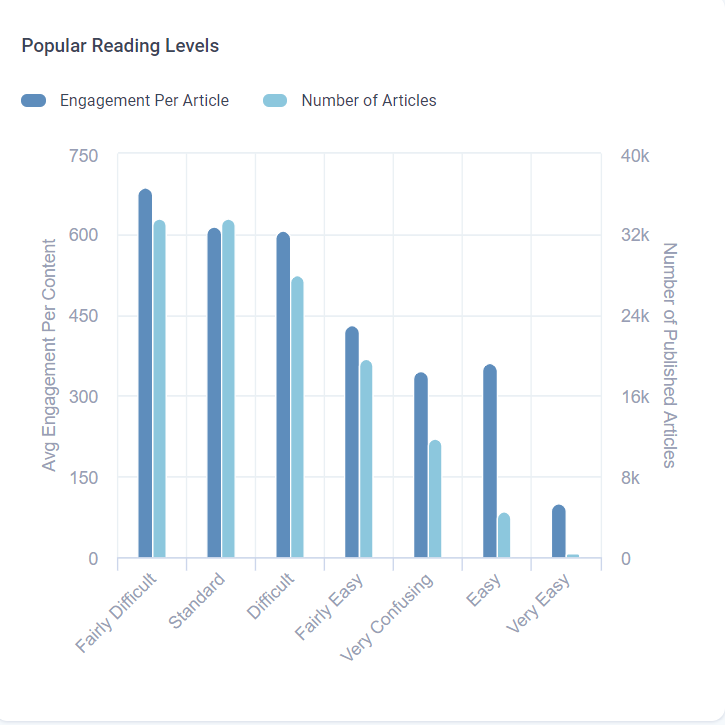
Writing styles and vocabulary varies from writer to writer. We have used highly sophisticated algorithms to segregate each article depending upon their reading levels.
Knowing your audience, you could choose articles based upon its reading level so they might easily digest the content.
The categories range from Fairly difficult, difficult all the way up to easy and very easy.
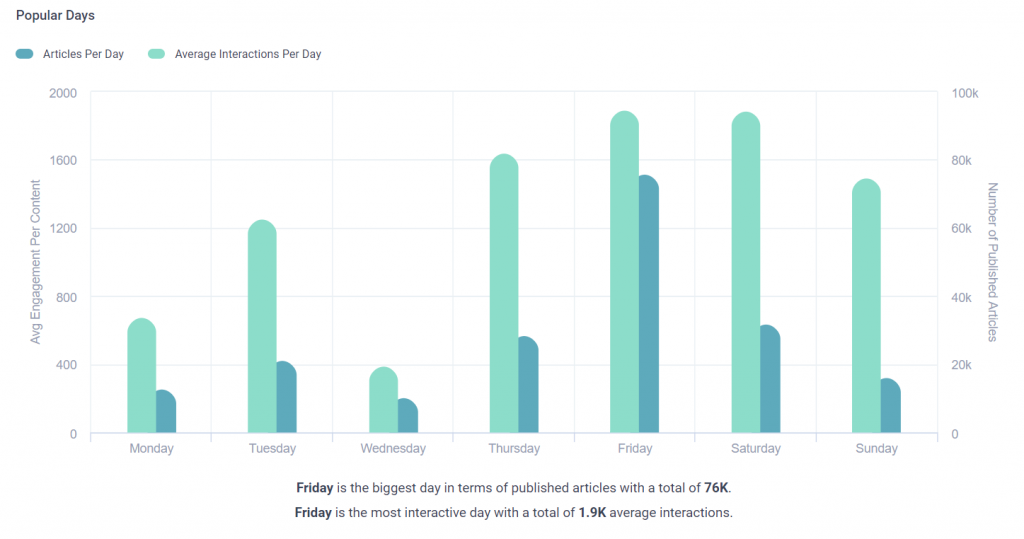
Popular Days
Popular days identify the days when publishing is at its peak. We not only identify the day but also show how many articles were published on each day.
This graph also shows Average interactions per day. Interaction is perceived as the number of visits/ views.
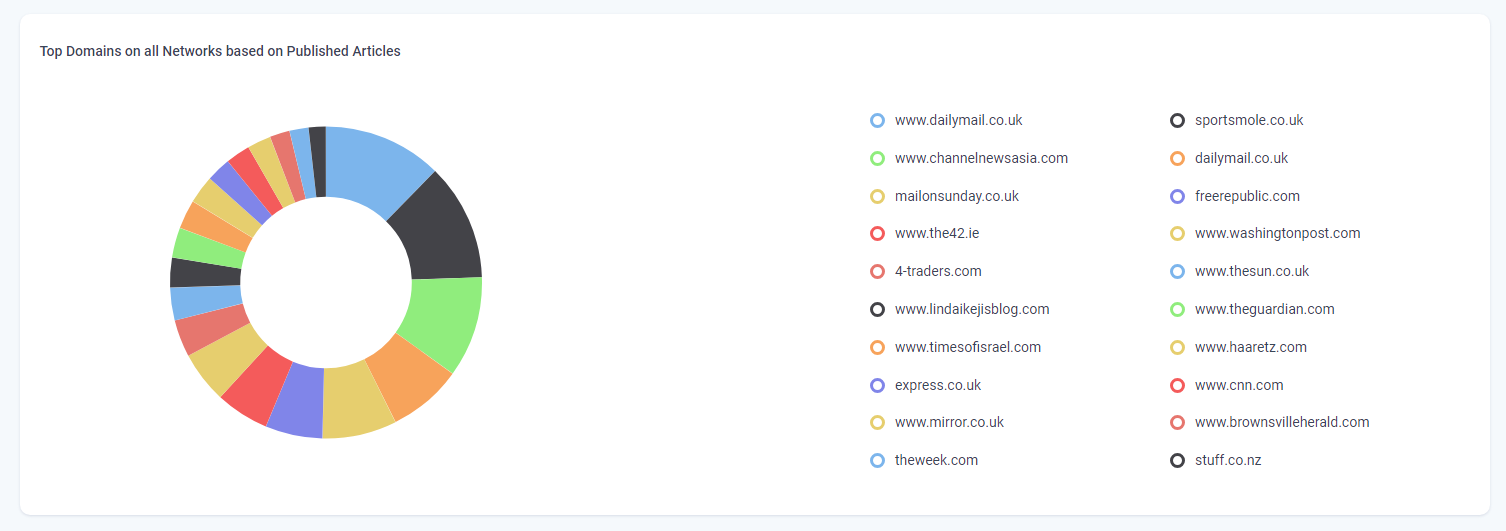
Top Domains on All Networks
These are the domains which have produced the most content. The data is elegantly displayed in a pie chart. Each domain making the cut gets a piece of the pie.
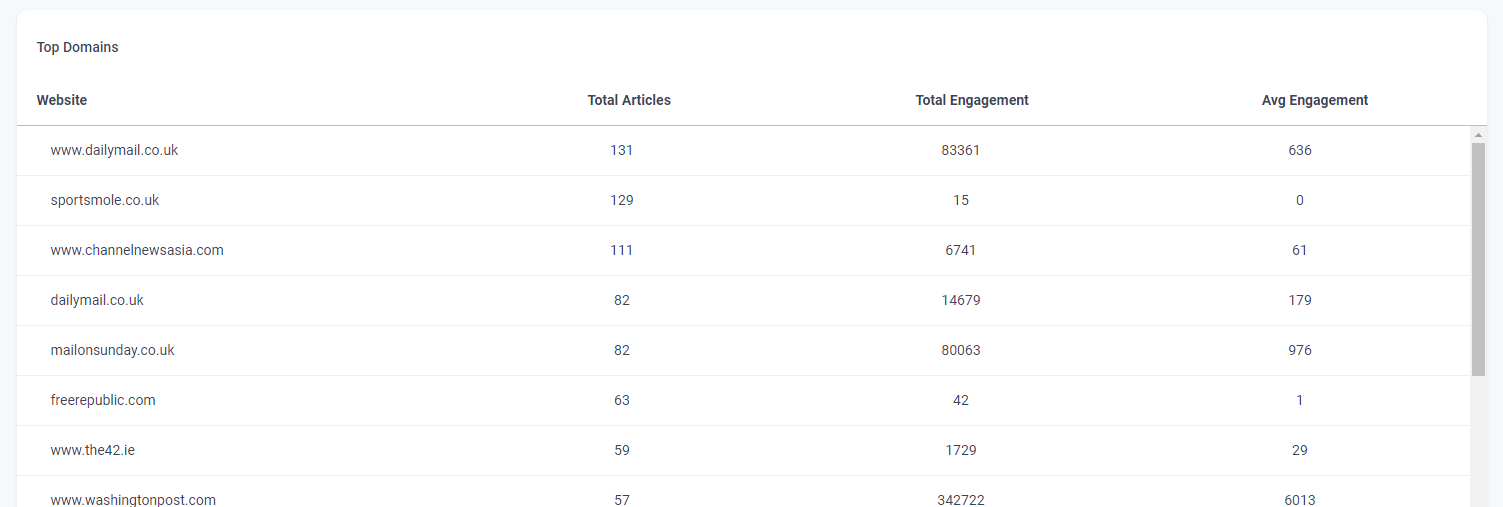
This section also depicts the total articles, total engagements and average engagement in a tabular form so to express why the criteria why domain have achieved their position.
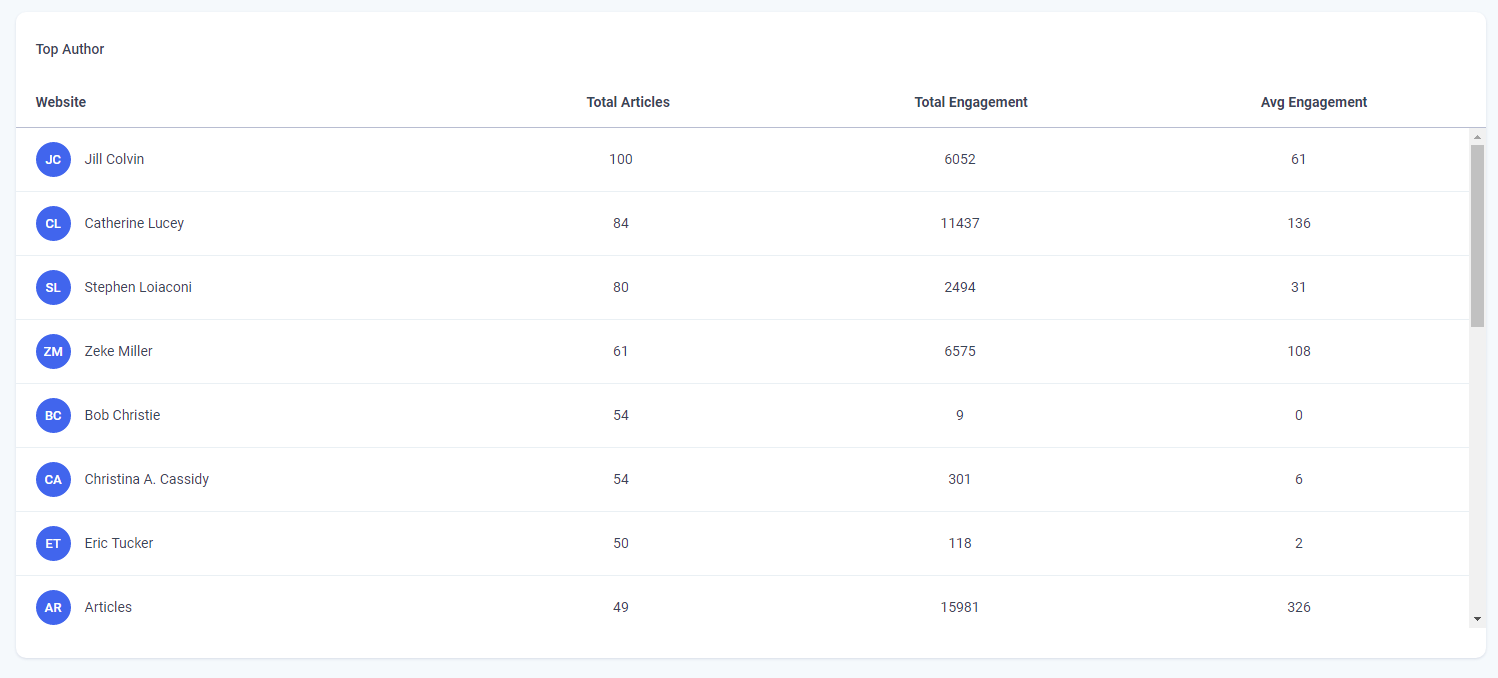
Top Author
The last section of insights is the “top author”. This tables shows which authors are producing the most content. Again this data is shown in a tabular form, with total articles, total engagements, and average engagements.
That’s all from Insights right now and we’ll tweak it further to make it according to your wishes.
Cover stories
Cover stories are articles cherry-picked from your curated topics. This section has been created to have instant access to the best-performing articles from each curated topic.
The great thing about cover stories is that you get a bird’s eye view of each curated topic. Viewing articles categorized by genre and engagement allows you to instantly share trending new rather than going through all of the feed.
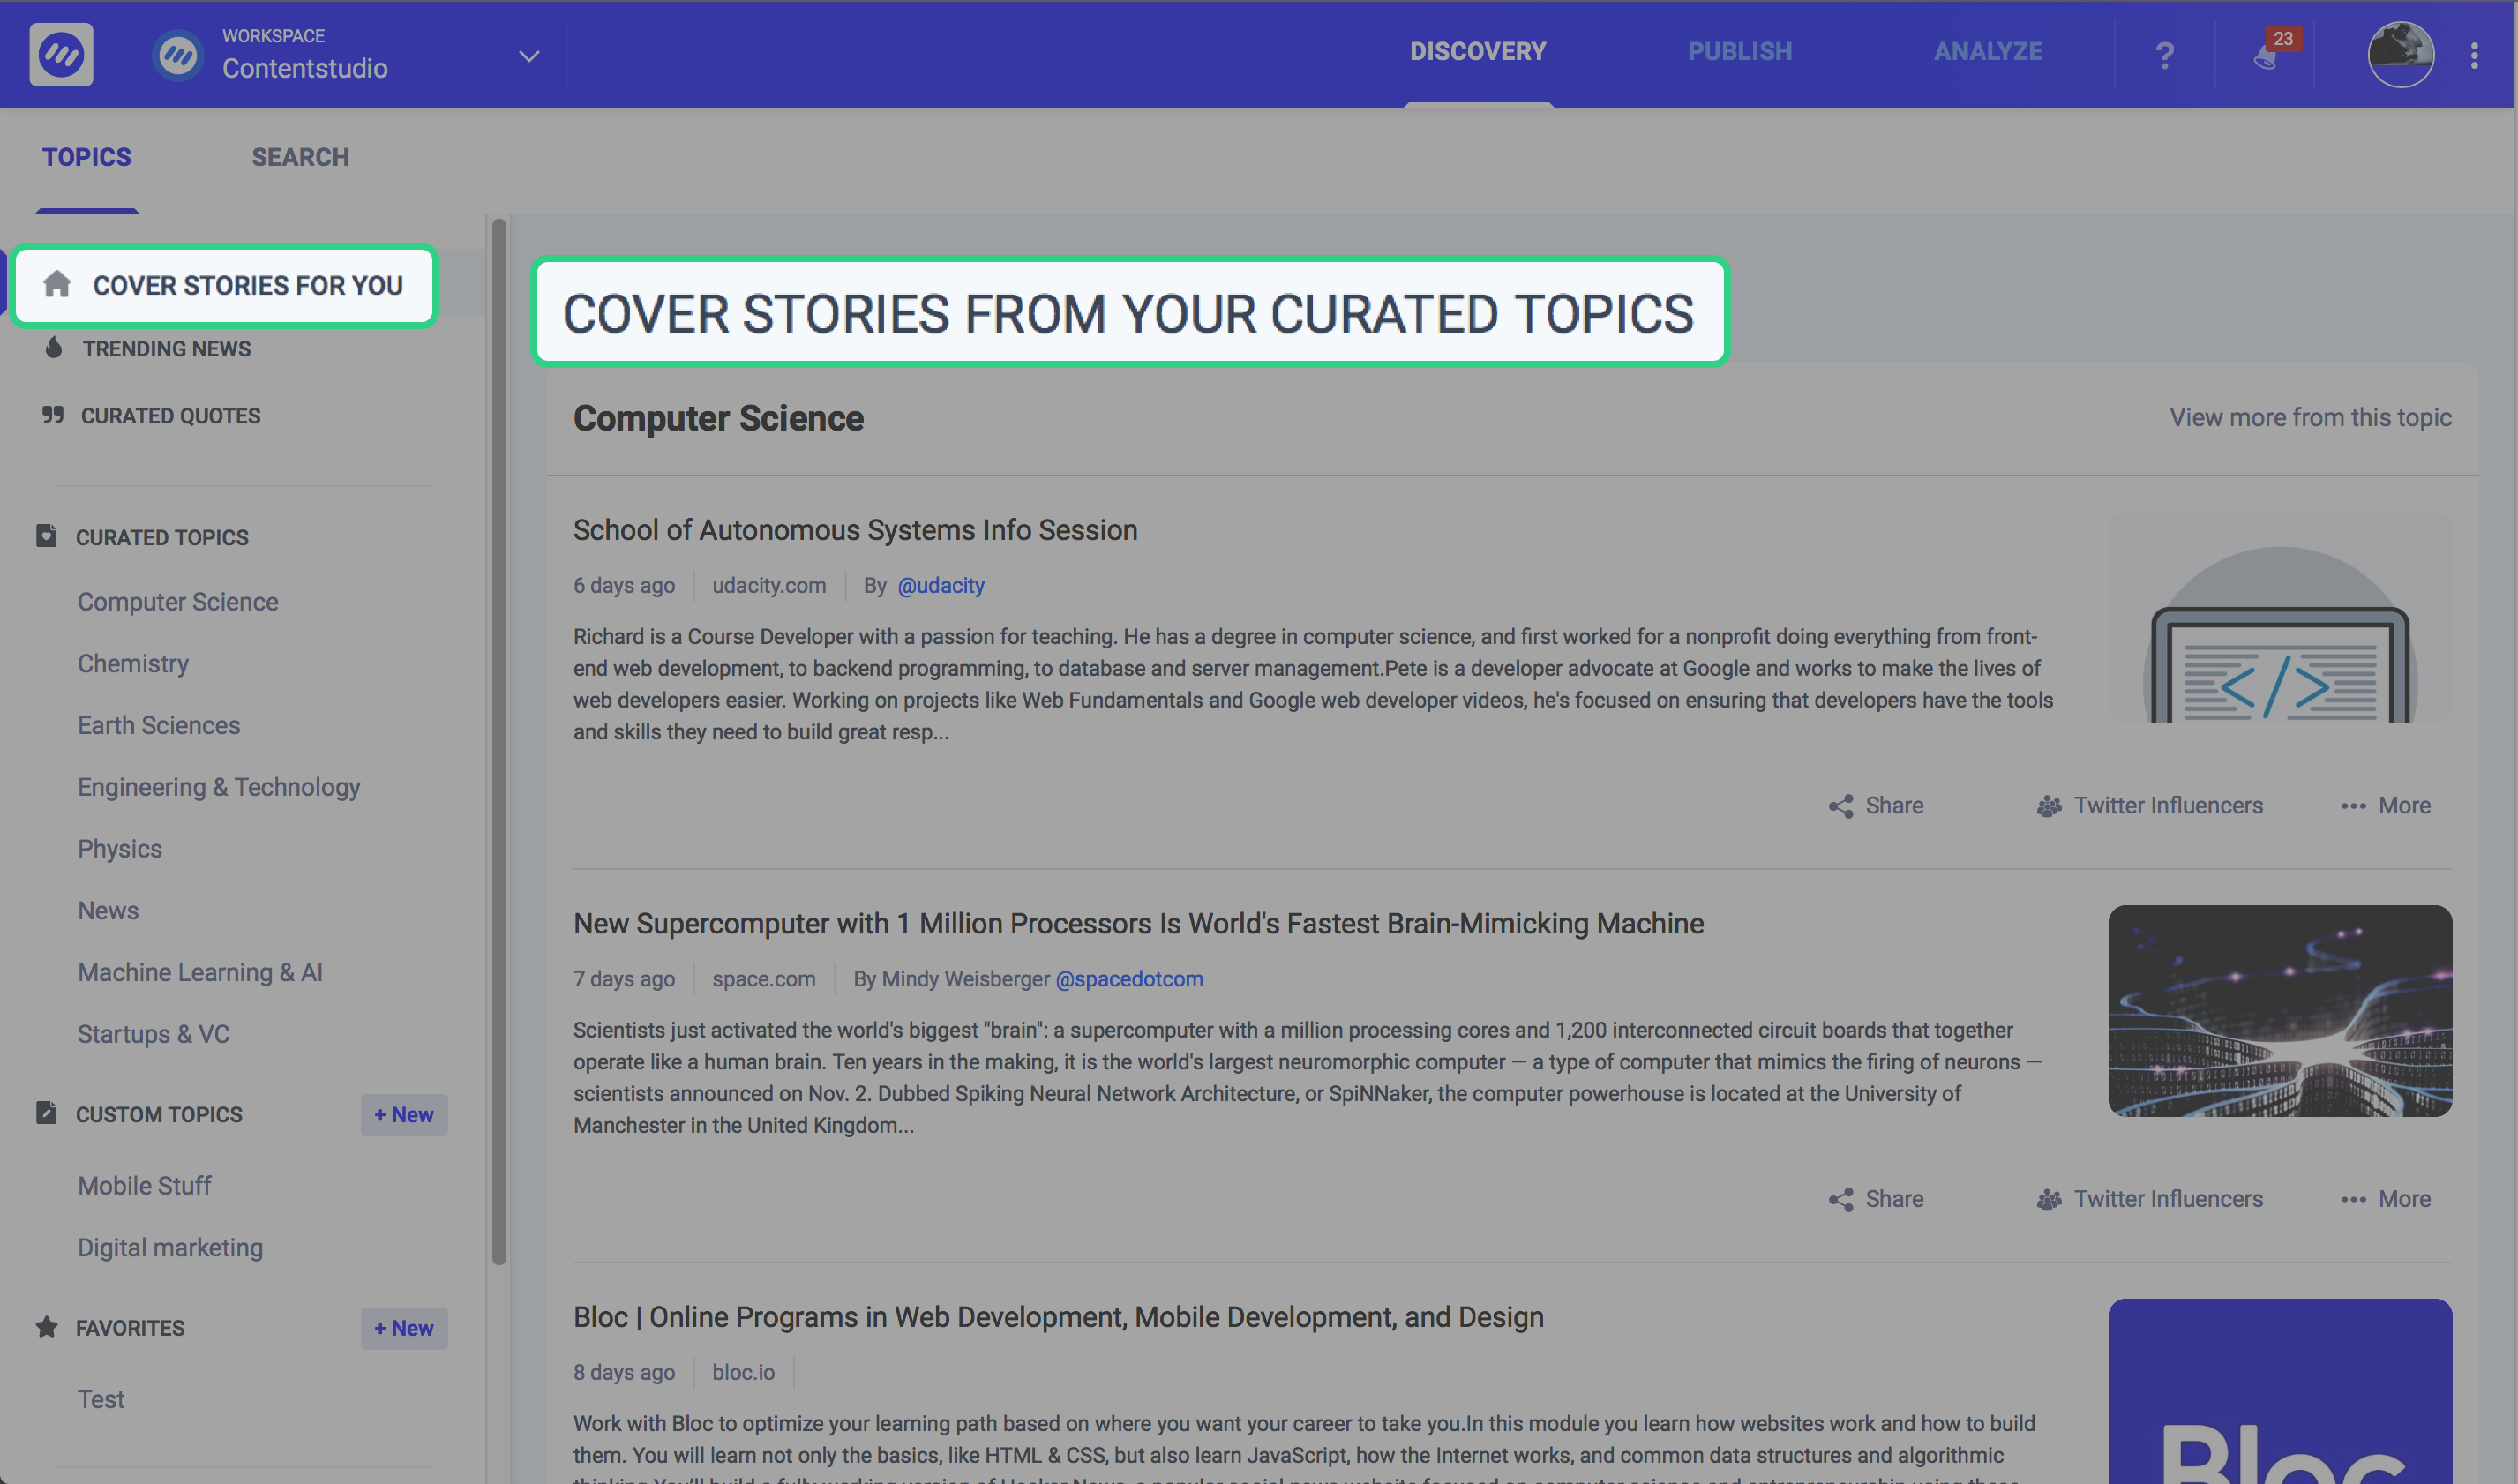
Let’s say that you have curated 4 topics namely computer science, chemistry, earth sciences, and Engineering and technology. The cover stories section will display the top 5 from each of these topics. These pieces are shortlisted on the basis of overall social engagement statistics.
So you will be shown top 3 articles from “computer science”, then 3 from “Chemistry”, so on so forth.
Sentiment Analysis
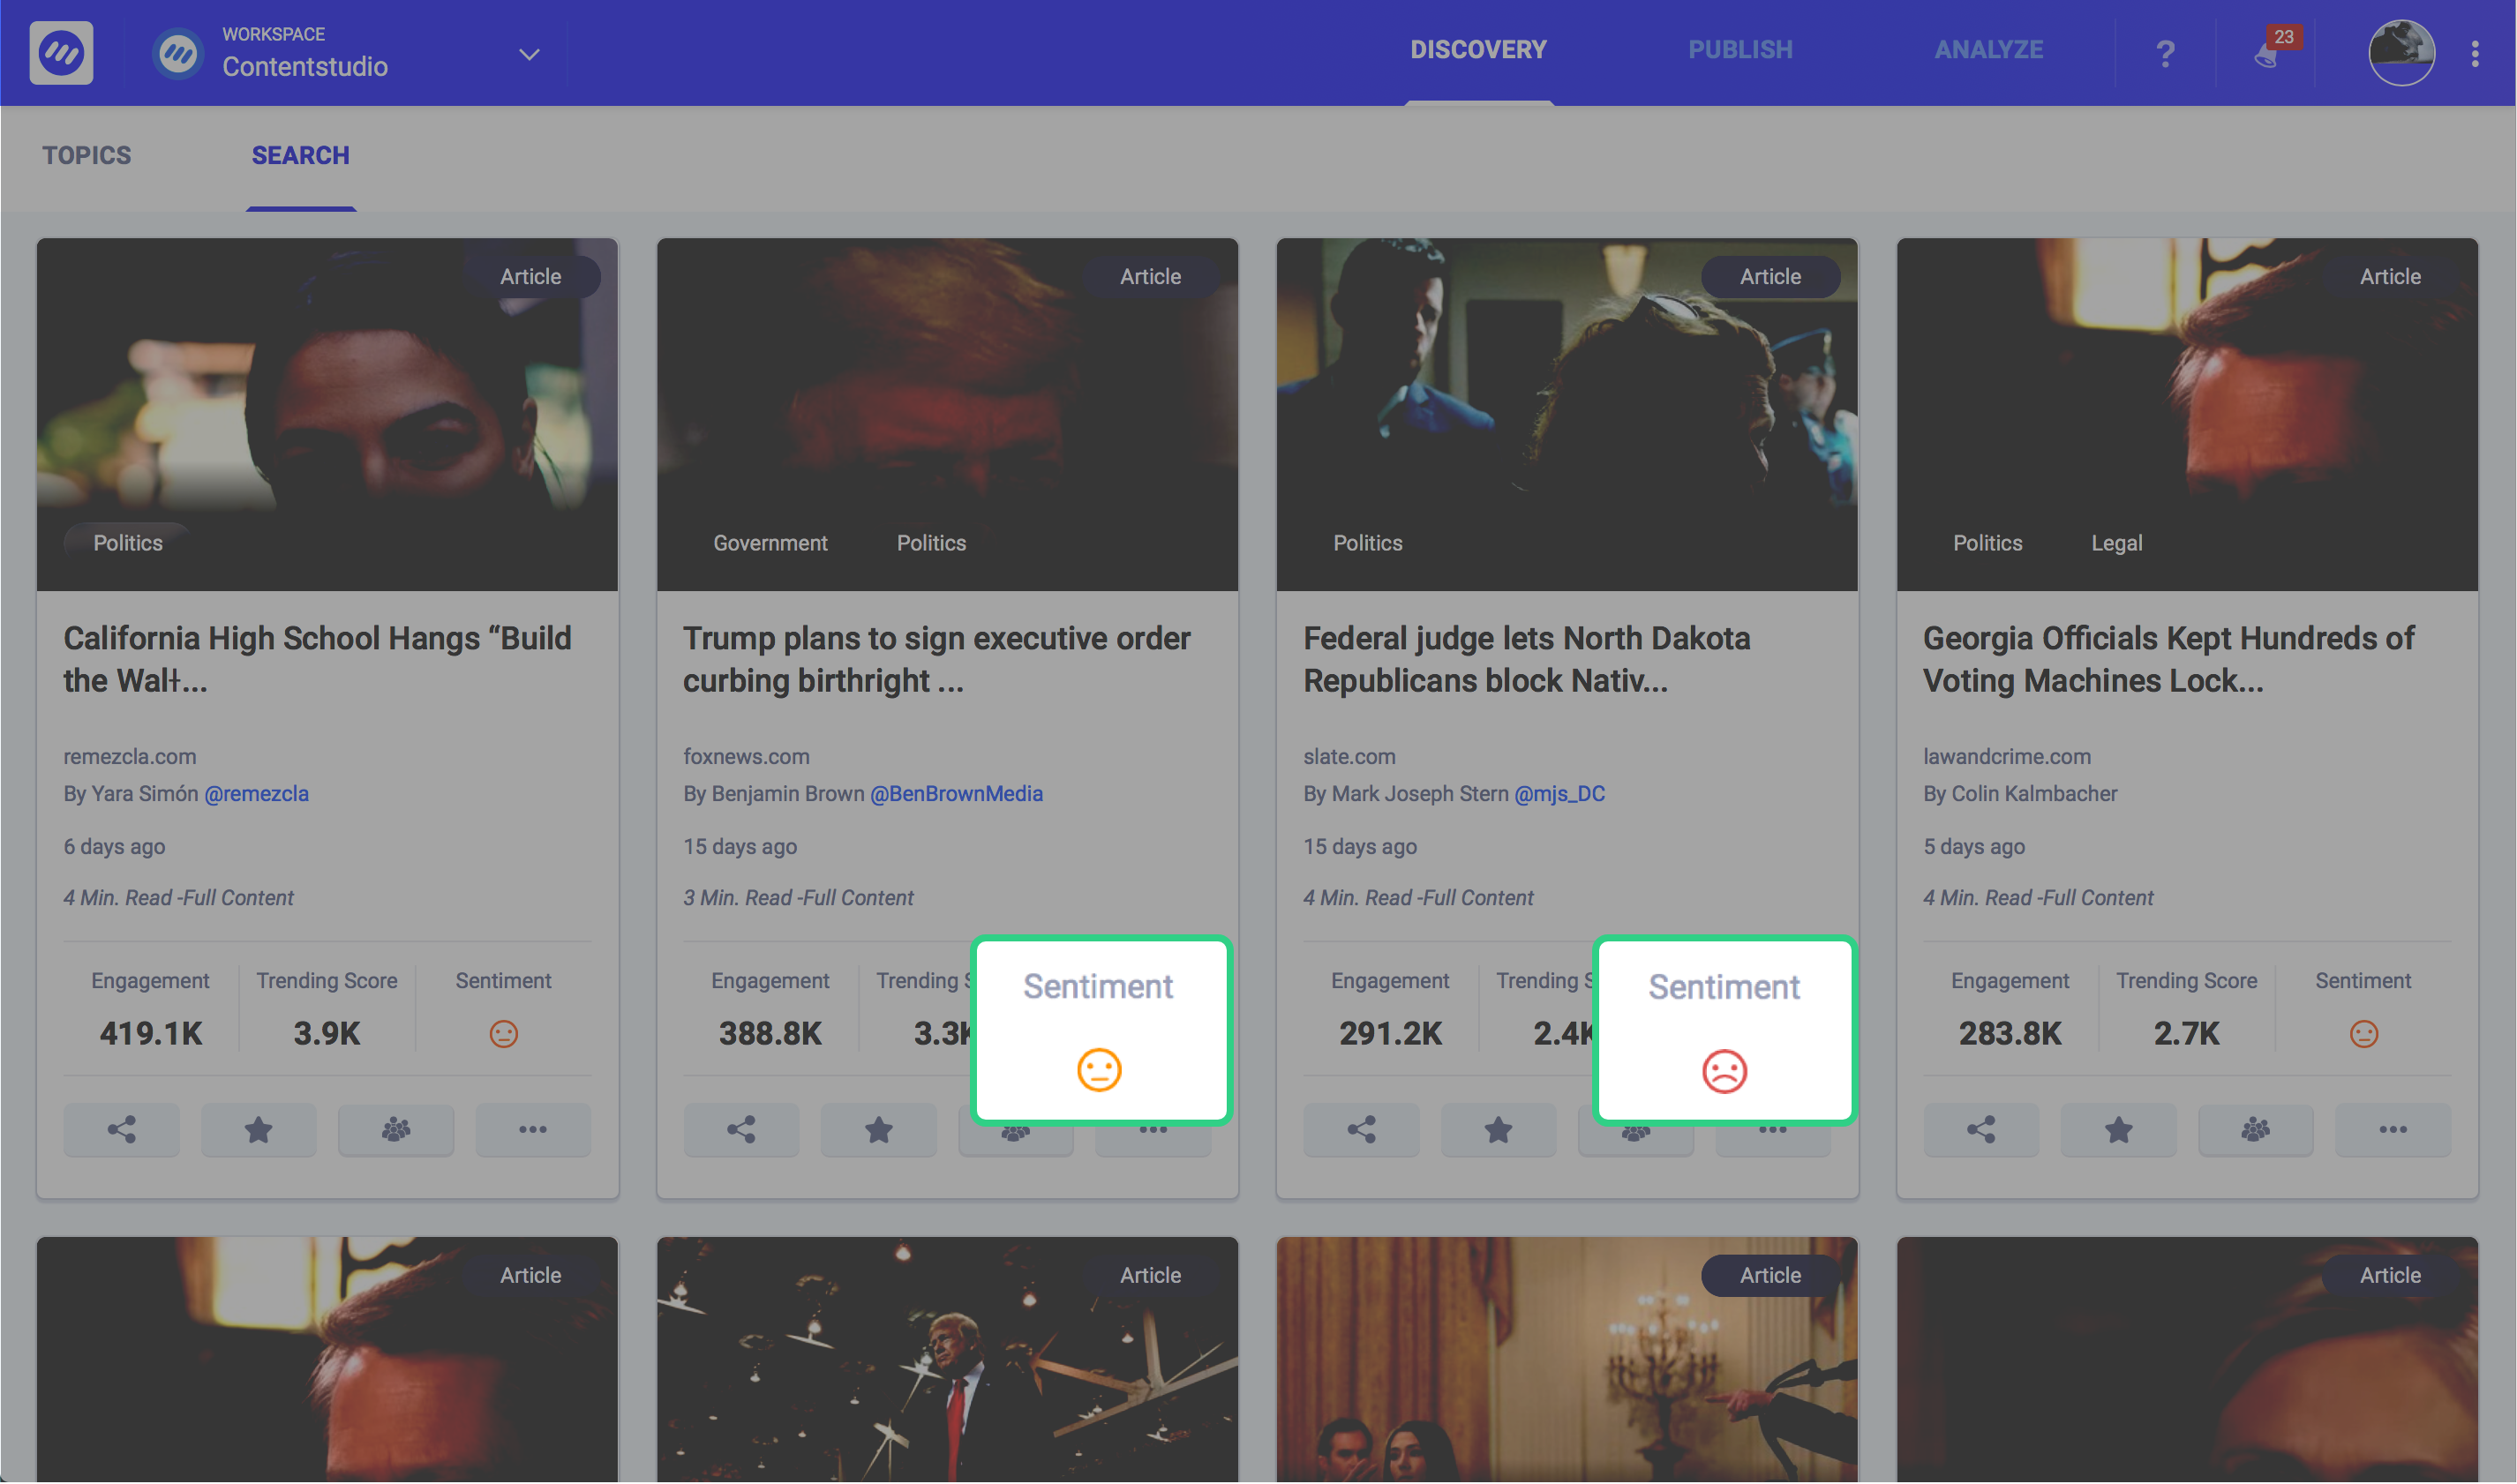
Sentiment Analysis predicts the writer’s attitude towards the topic. The writer’s approach could be one of the three: positive, negative or neutral.
ContentStudio sentiment analysis feature categorizes by analyzing the opinion of the document. The sentiment of an article is calculated on the basis of two things: the Overall emotion of the article and the magnitude of the emotional content that is present.
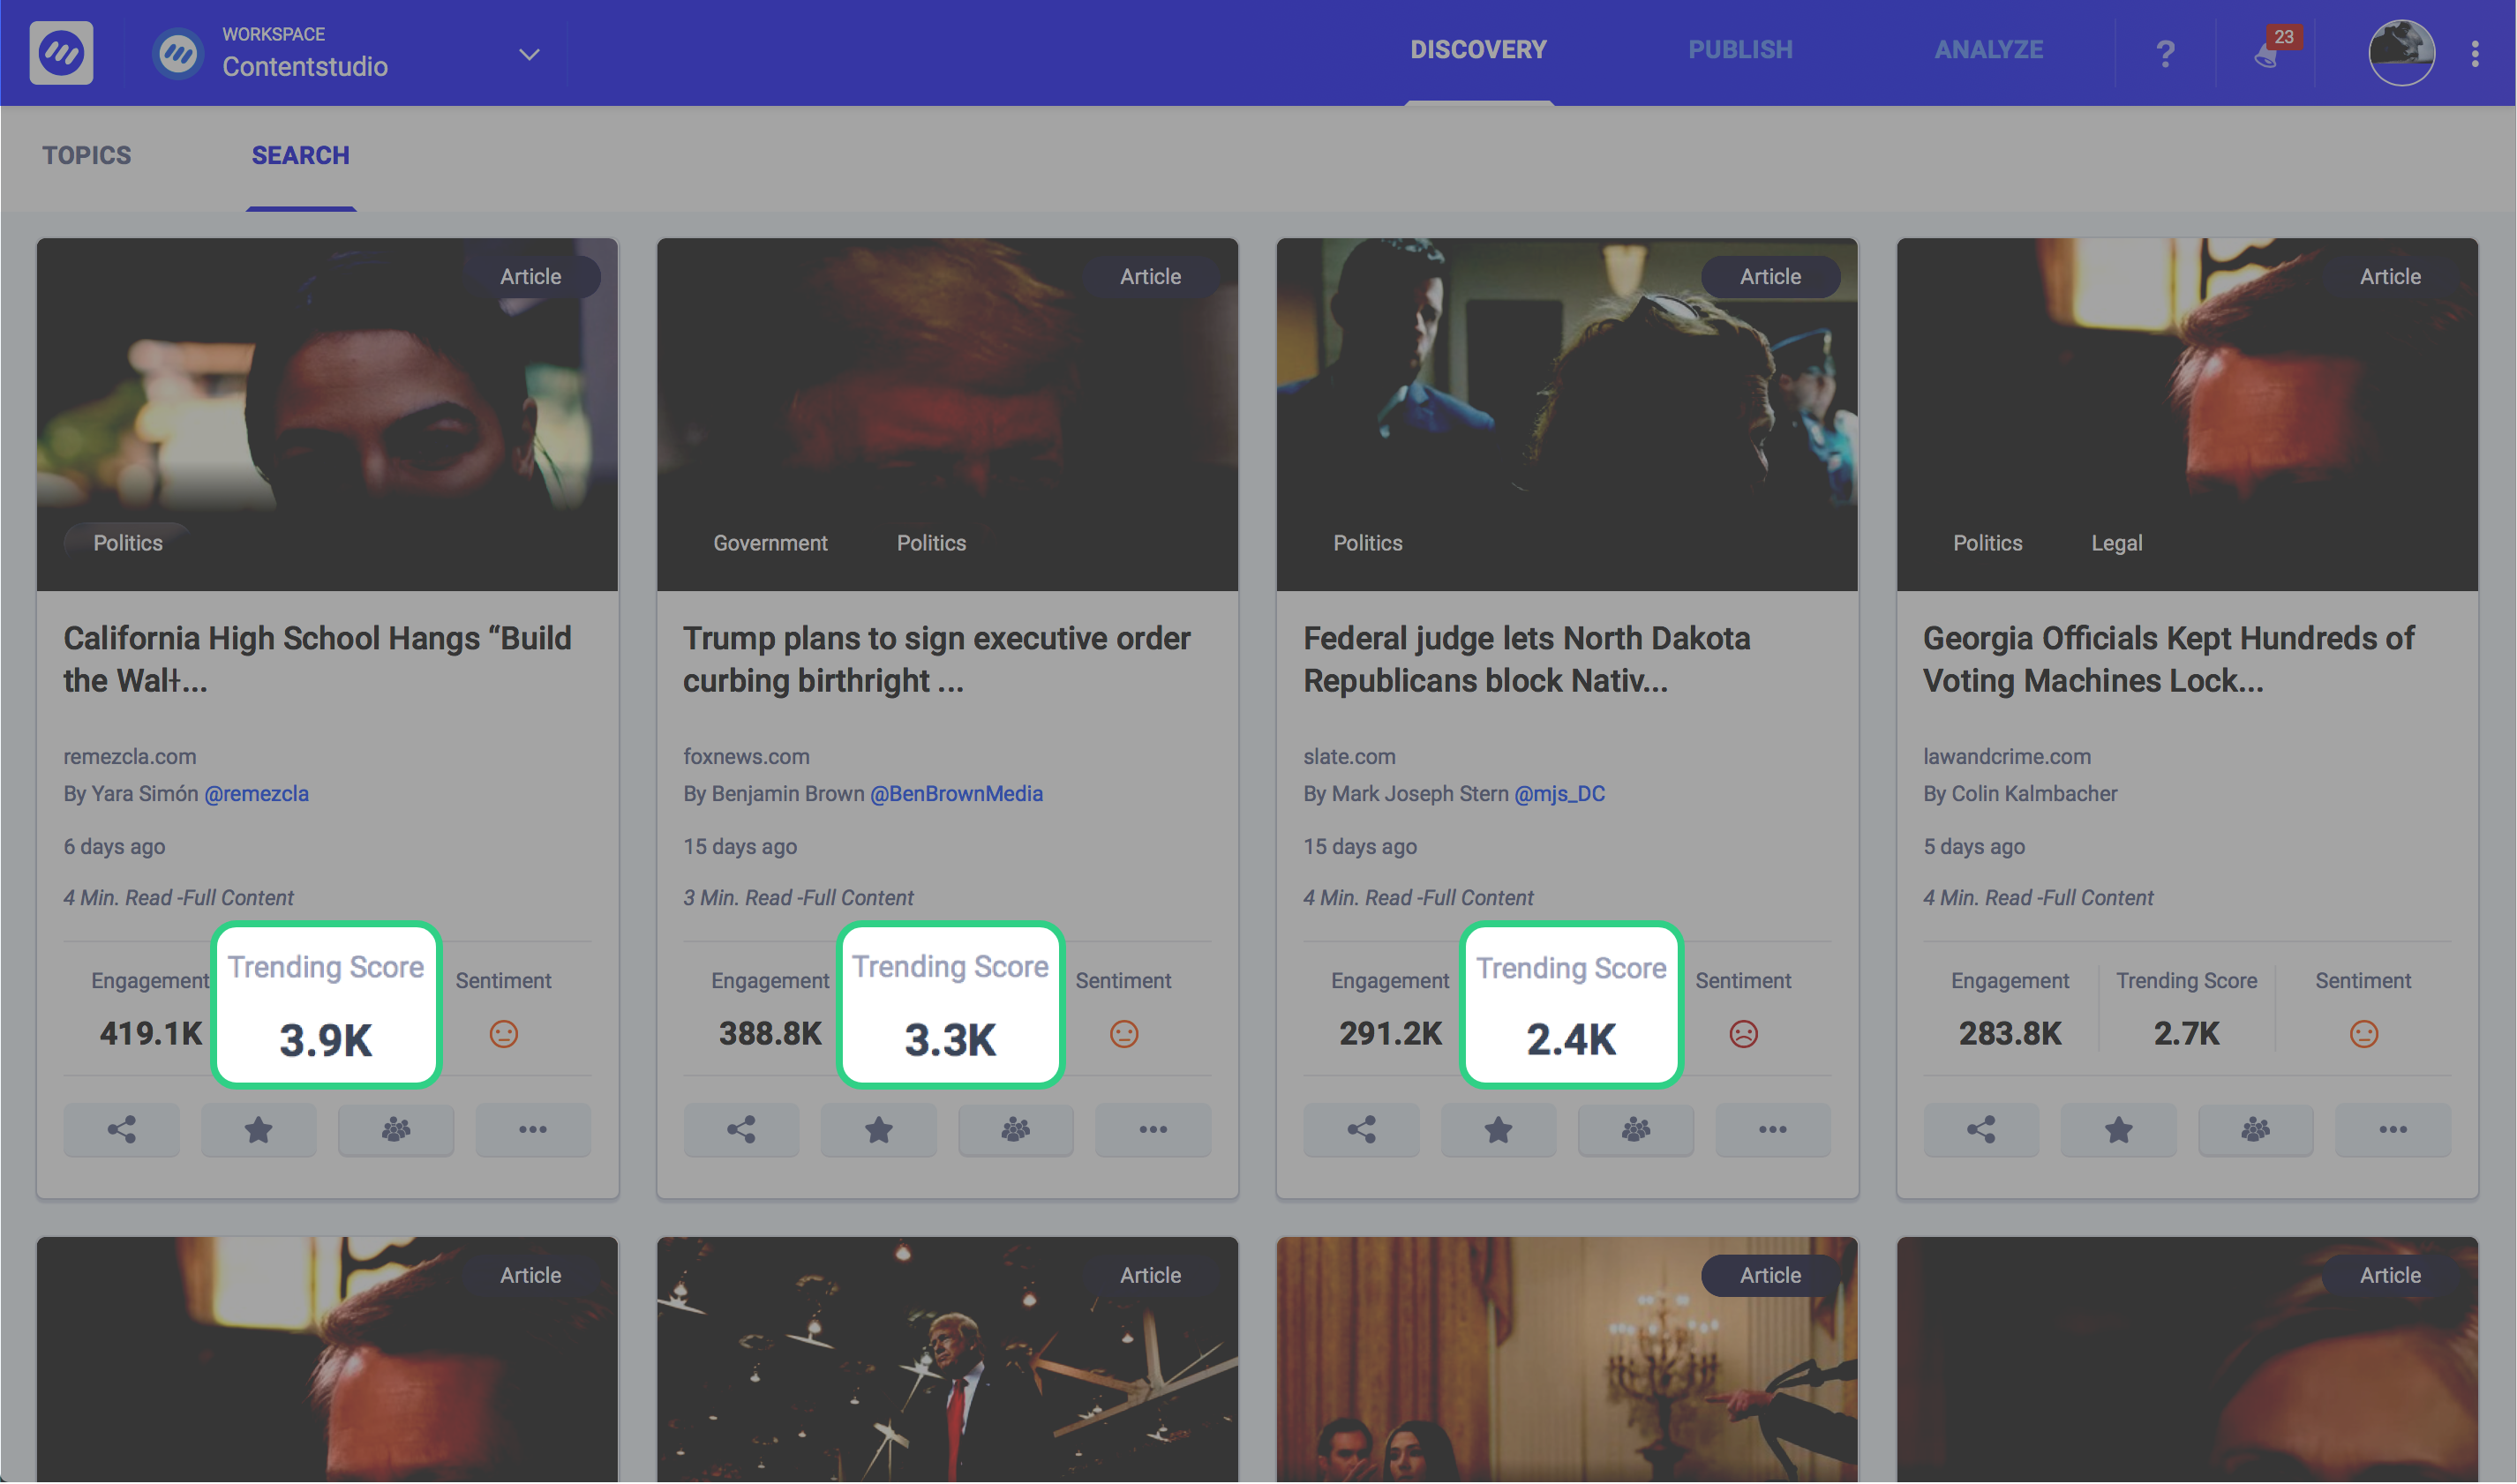
Trending Score
In version 2.0, we have integrated a better approach towards the trending score which helps users identify which articles to share and drive more traffic towards their platform. Our new custom algorithm takes into account the change of engagements over a period of time and adjusts the score accordingly.
As an example, article A and B were both published 3 days ago. Each has a total social engagement of 10k. While A received most of its engagements in the first two days and the reviews that B gets increases day by day, the trending score of B will be higher, which fits right into the use case.
This way you get the true and most recent trending score value for each article.
Improved Curated Quotes
Another cool section which we have improved for you is the “Curated Quotes”. We have massively increased the database of curated quotes.
Quotes are a great way to express sentiments. They embody thought authenticity and graphics. Personal and business social accounts are stormed with quotes, some even sharing them on a daily basis.
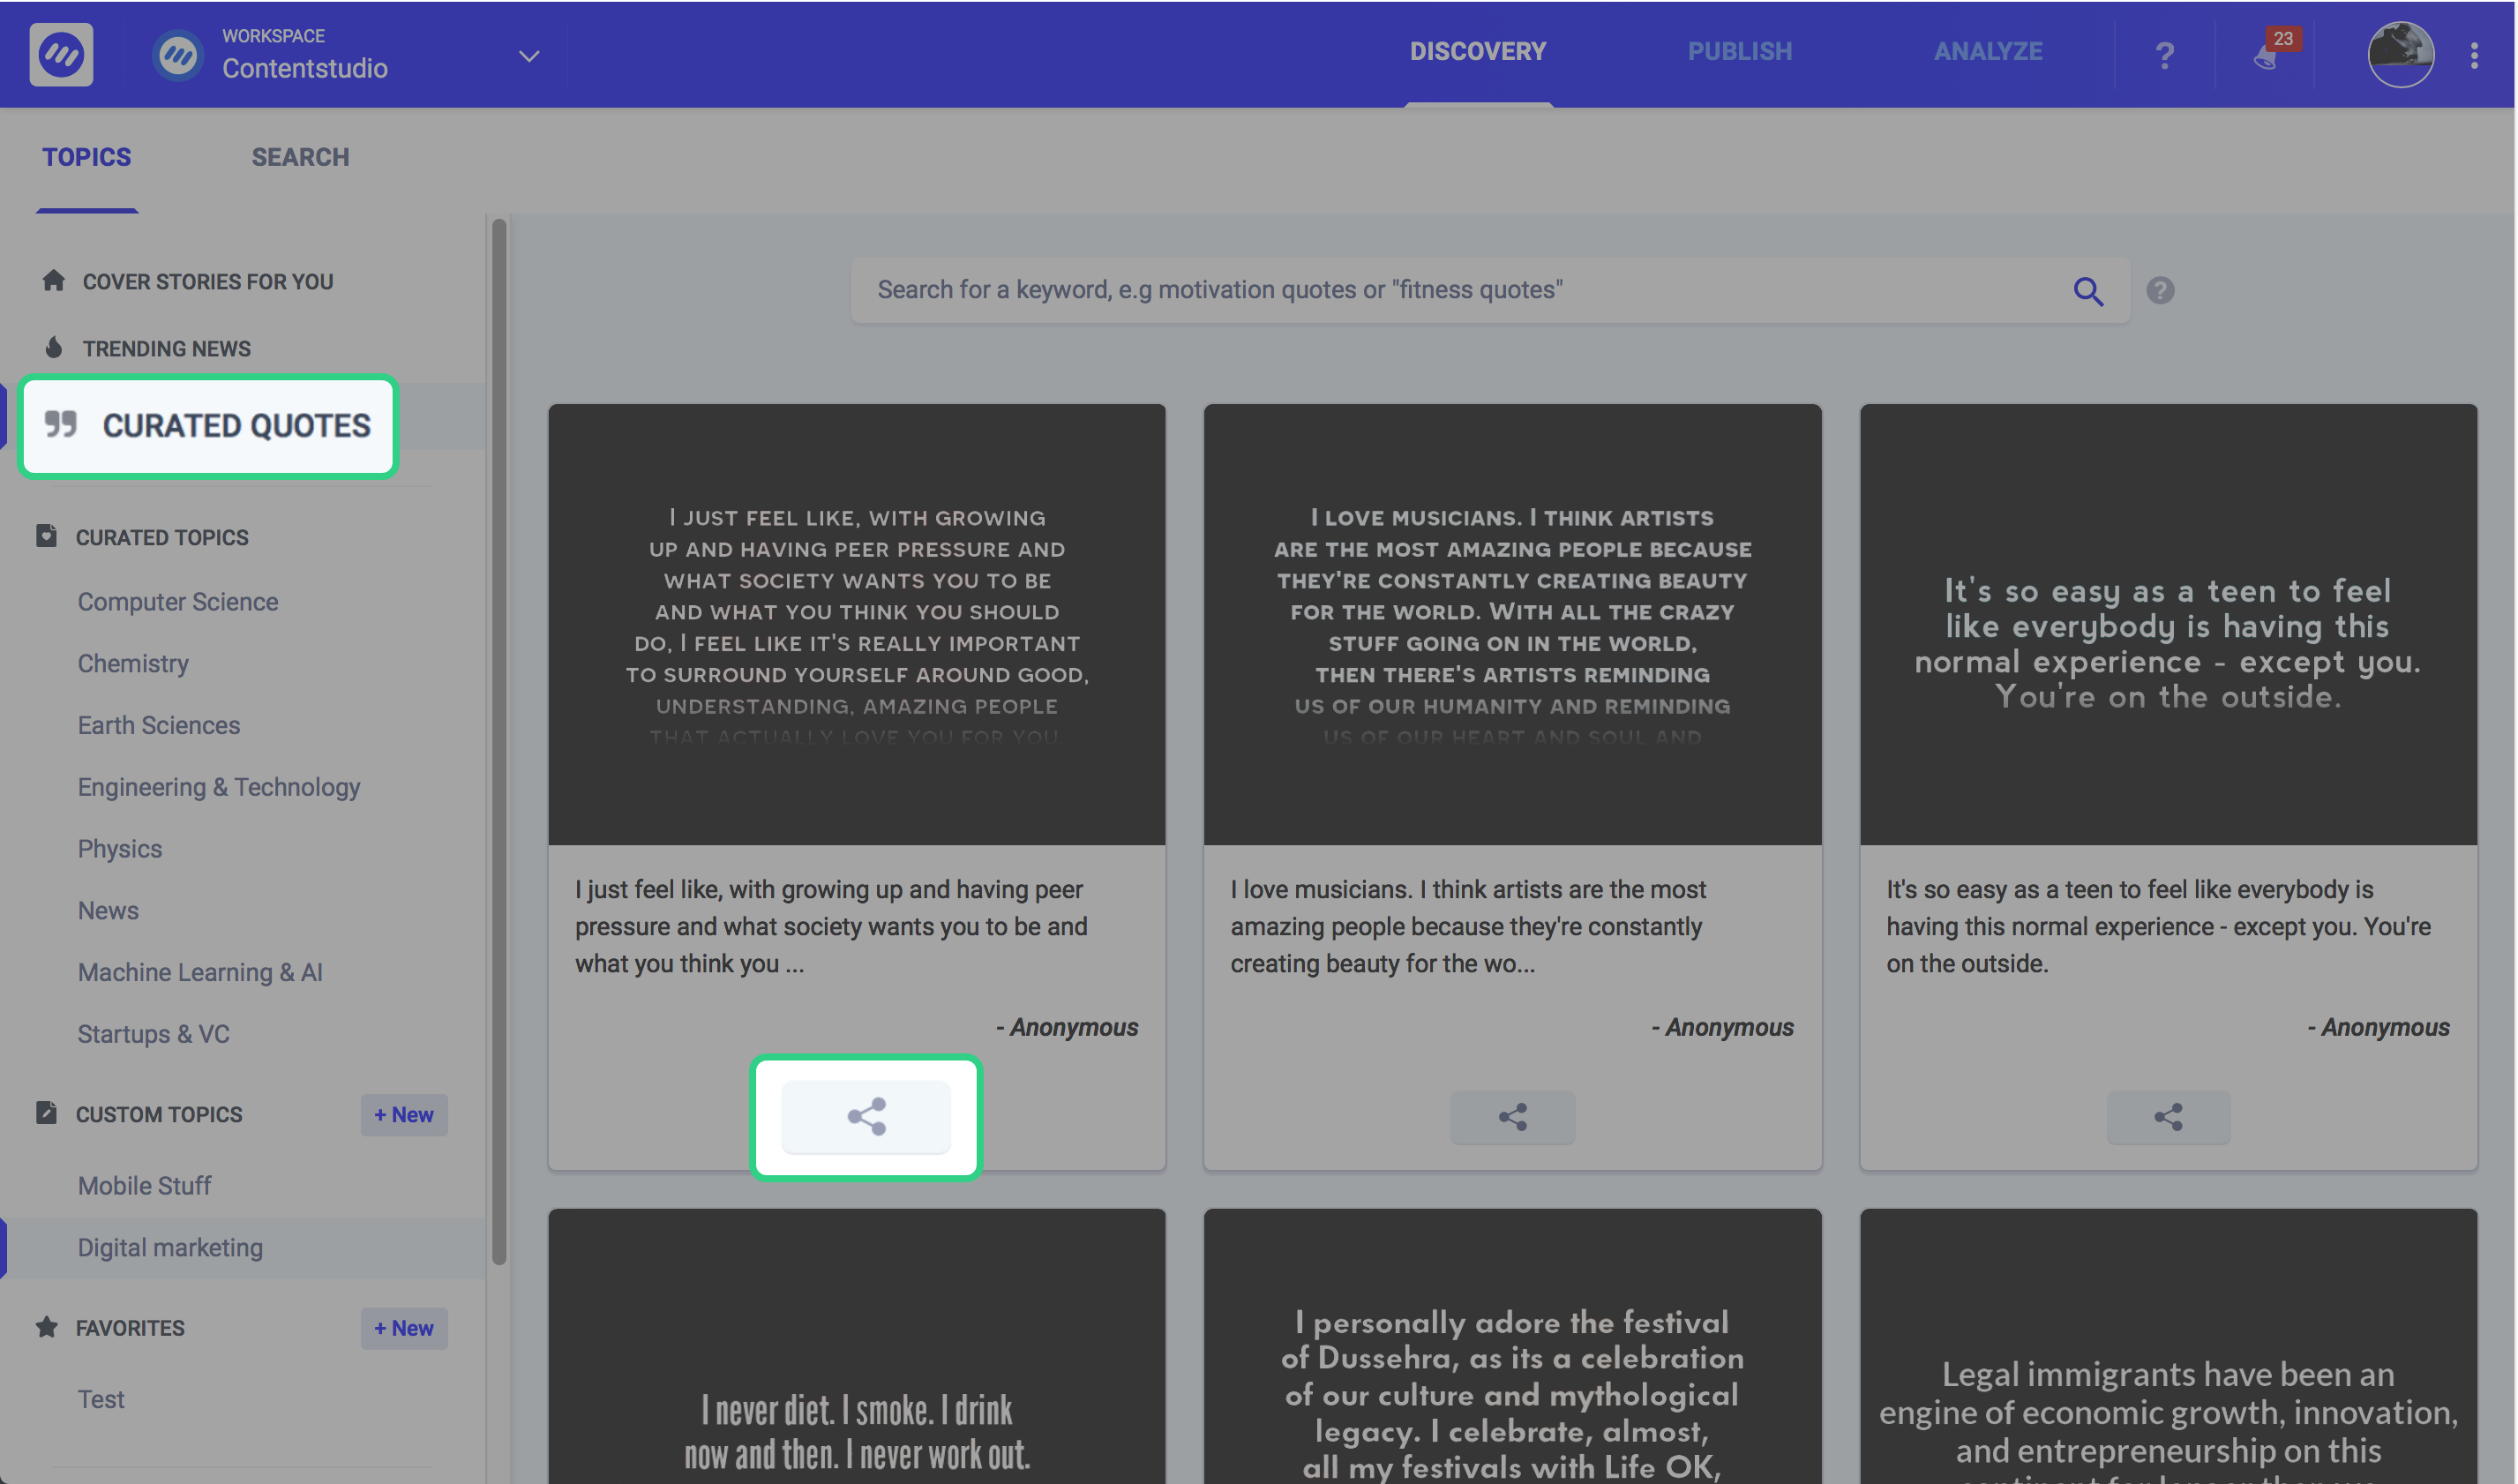
We have made it push button simple!
Our system crawls the web and we create the quotes. You are presented with a fresh set of quotes for all trending subjects.
What you need to do is to shortlist the quote which you like and just click on the share icon to publish it across social media platforms.
Trending News
This was already present in the previous system but this will not be the default view where you land when you come to discovery because a lot of you are not interested in news and many of you have been reading and sharing news from this section.
So, if you are interested in worldwide news regarding politics, sports, business, technology or weather, this is the place for you. This section specifically focusses on the news and nothing else. This just might be your new favorite news reader.
The news can be segregated w.r.t sharing engagements, time period region, and language. Each content piece is individually analyzed and assigned a trending score and sentiment depending upon whether the news is positive negative or neutral.
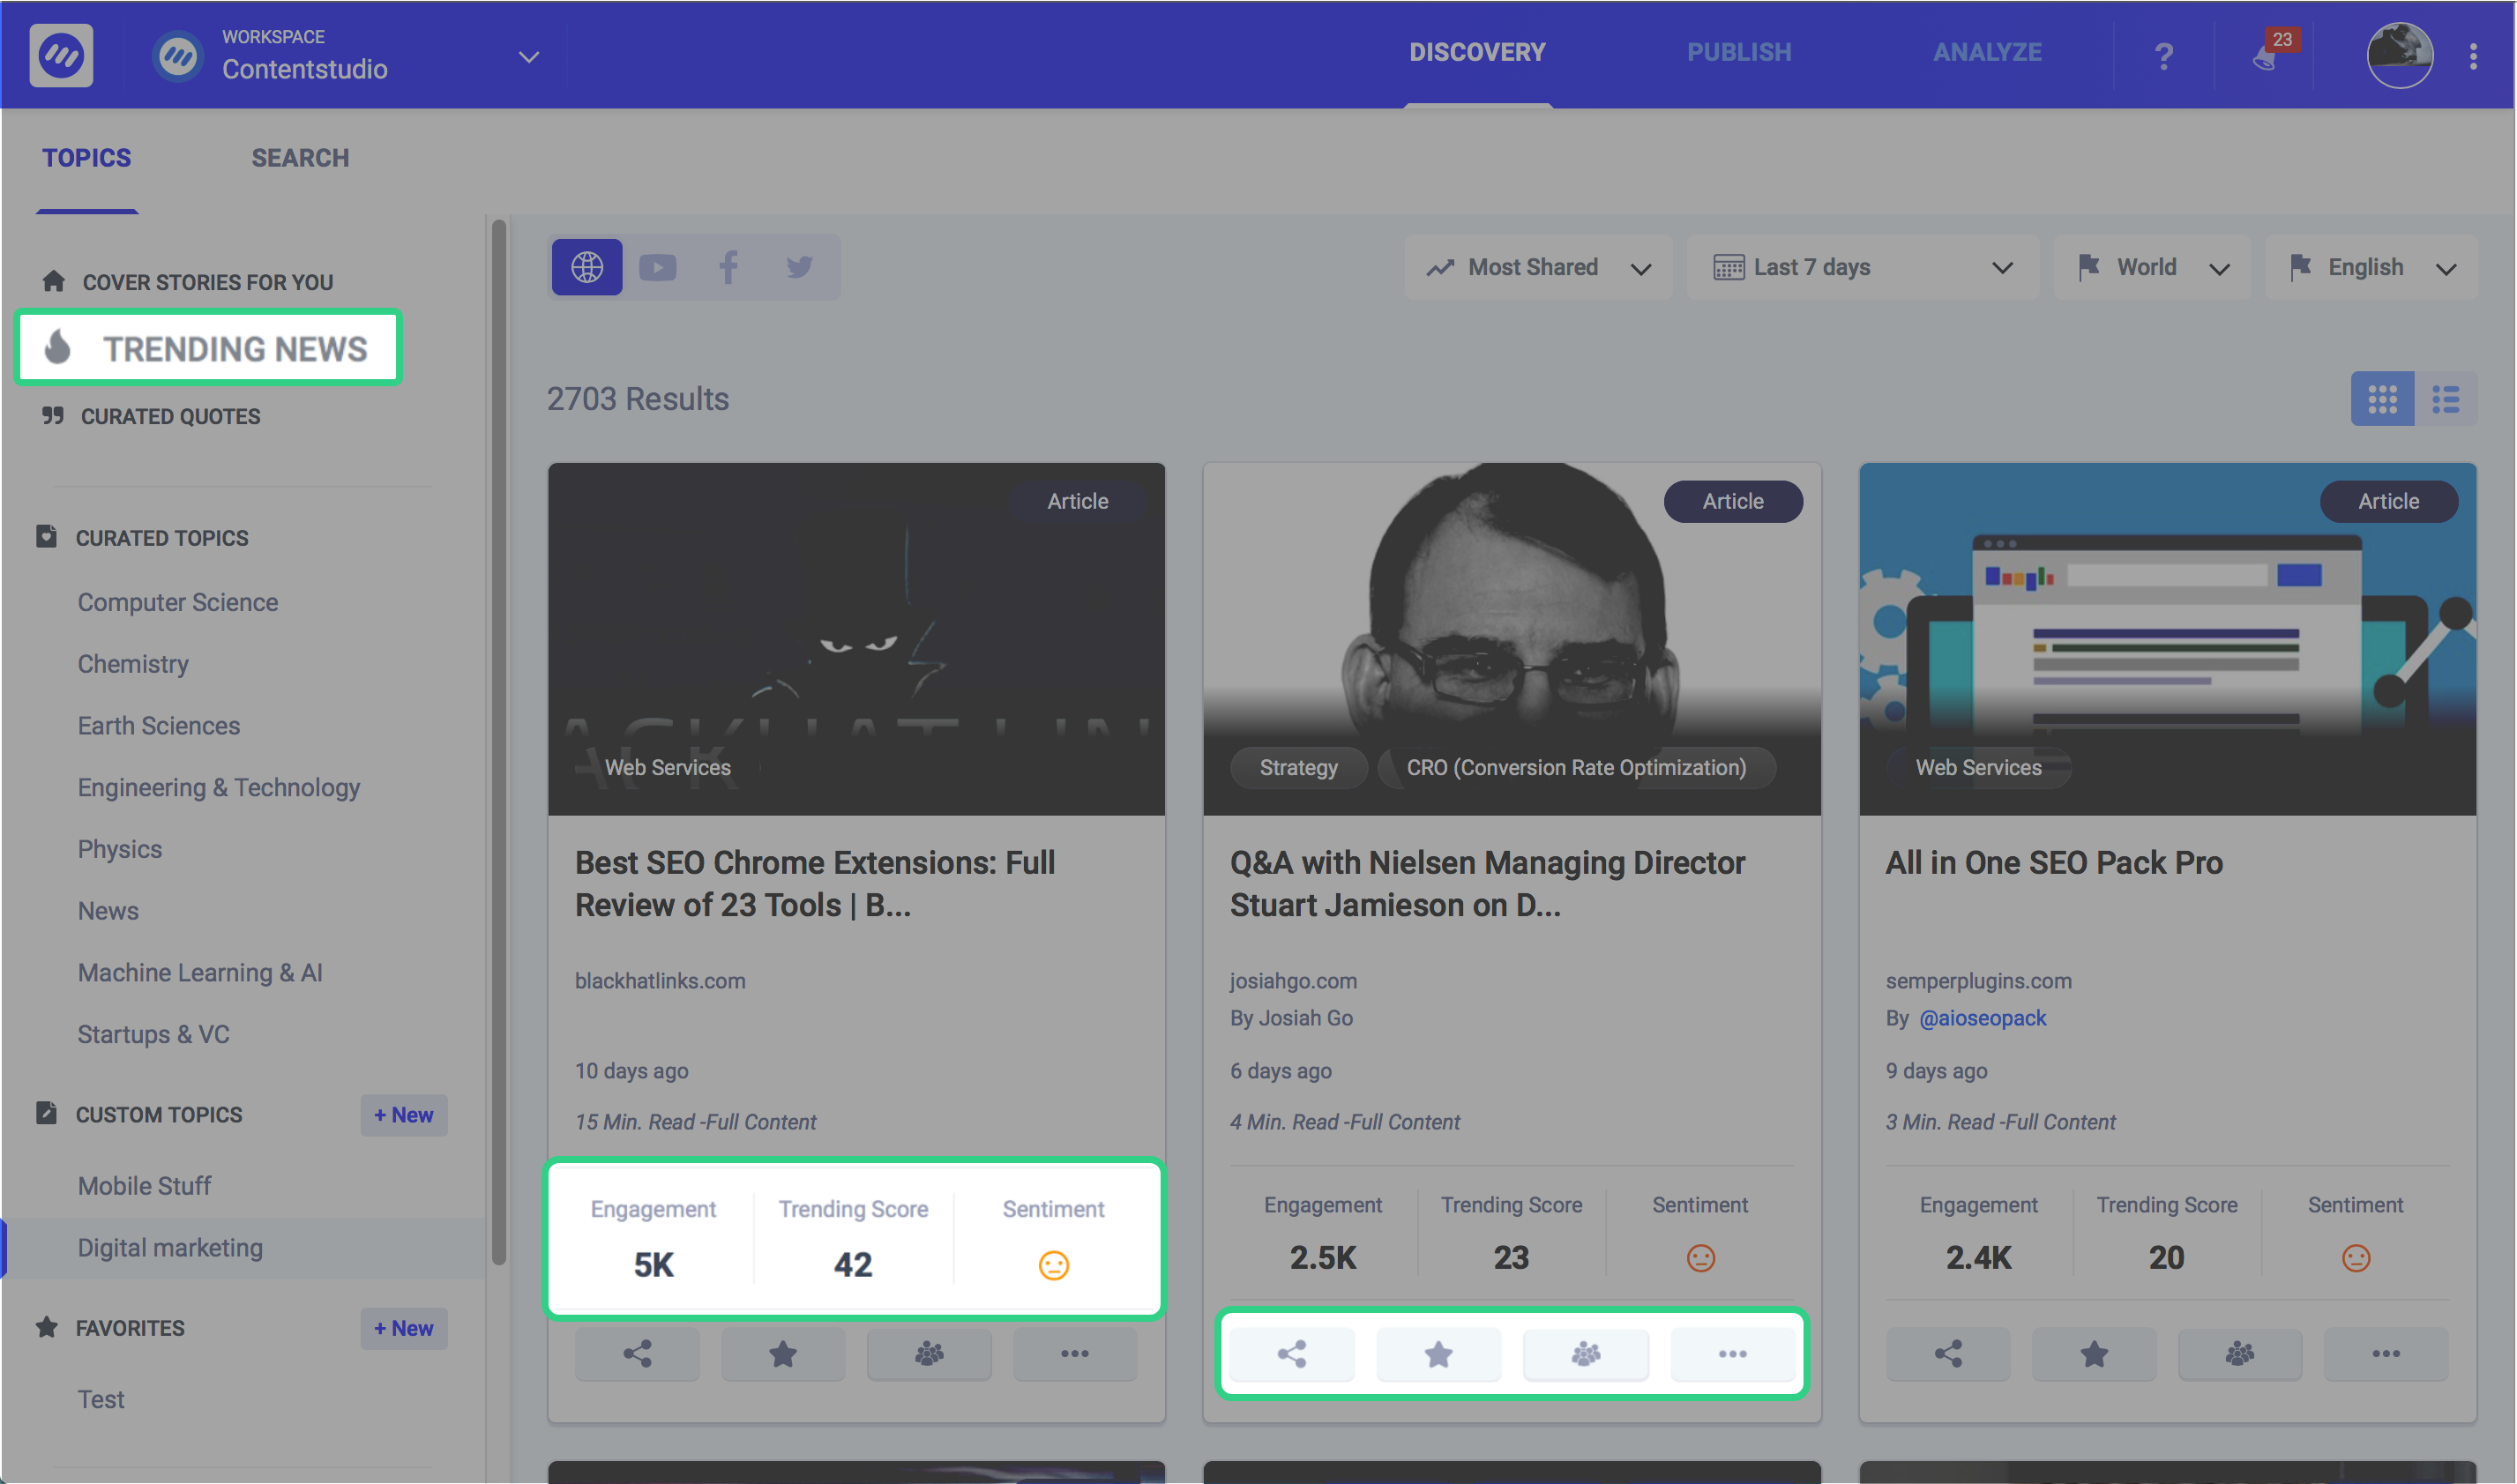
If you like any particular news, you can share it across your social media channels by clicking the share icon. You can also favorite it and save it in a folder for later viewing.
You can also view the number of time a certain post was shared on Twitter. This cements the authenticity of its virality. In addition to that, you can use our Pocket integration to view this news at a later point in time. Pocket is an application and web service for managing a reading list of articles from the Internet. It is available for all types of mobile devices and web browsers.
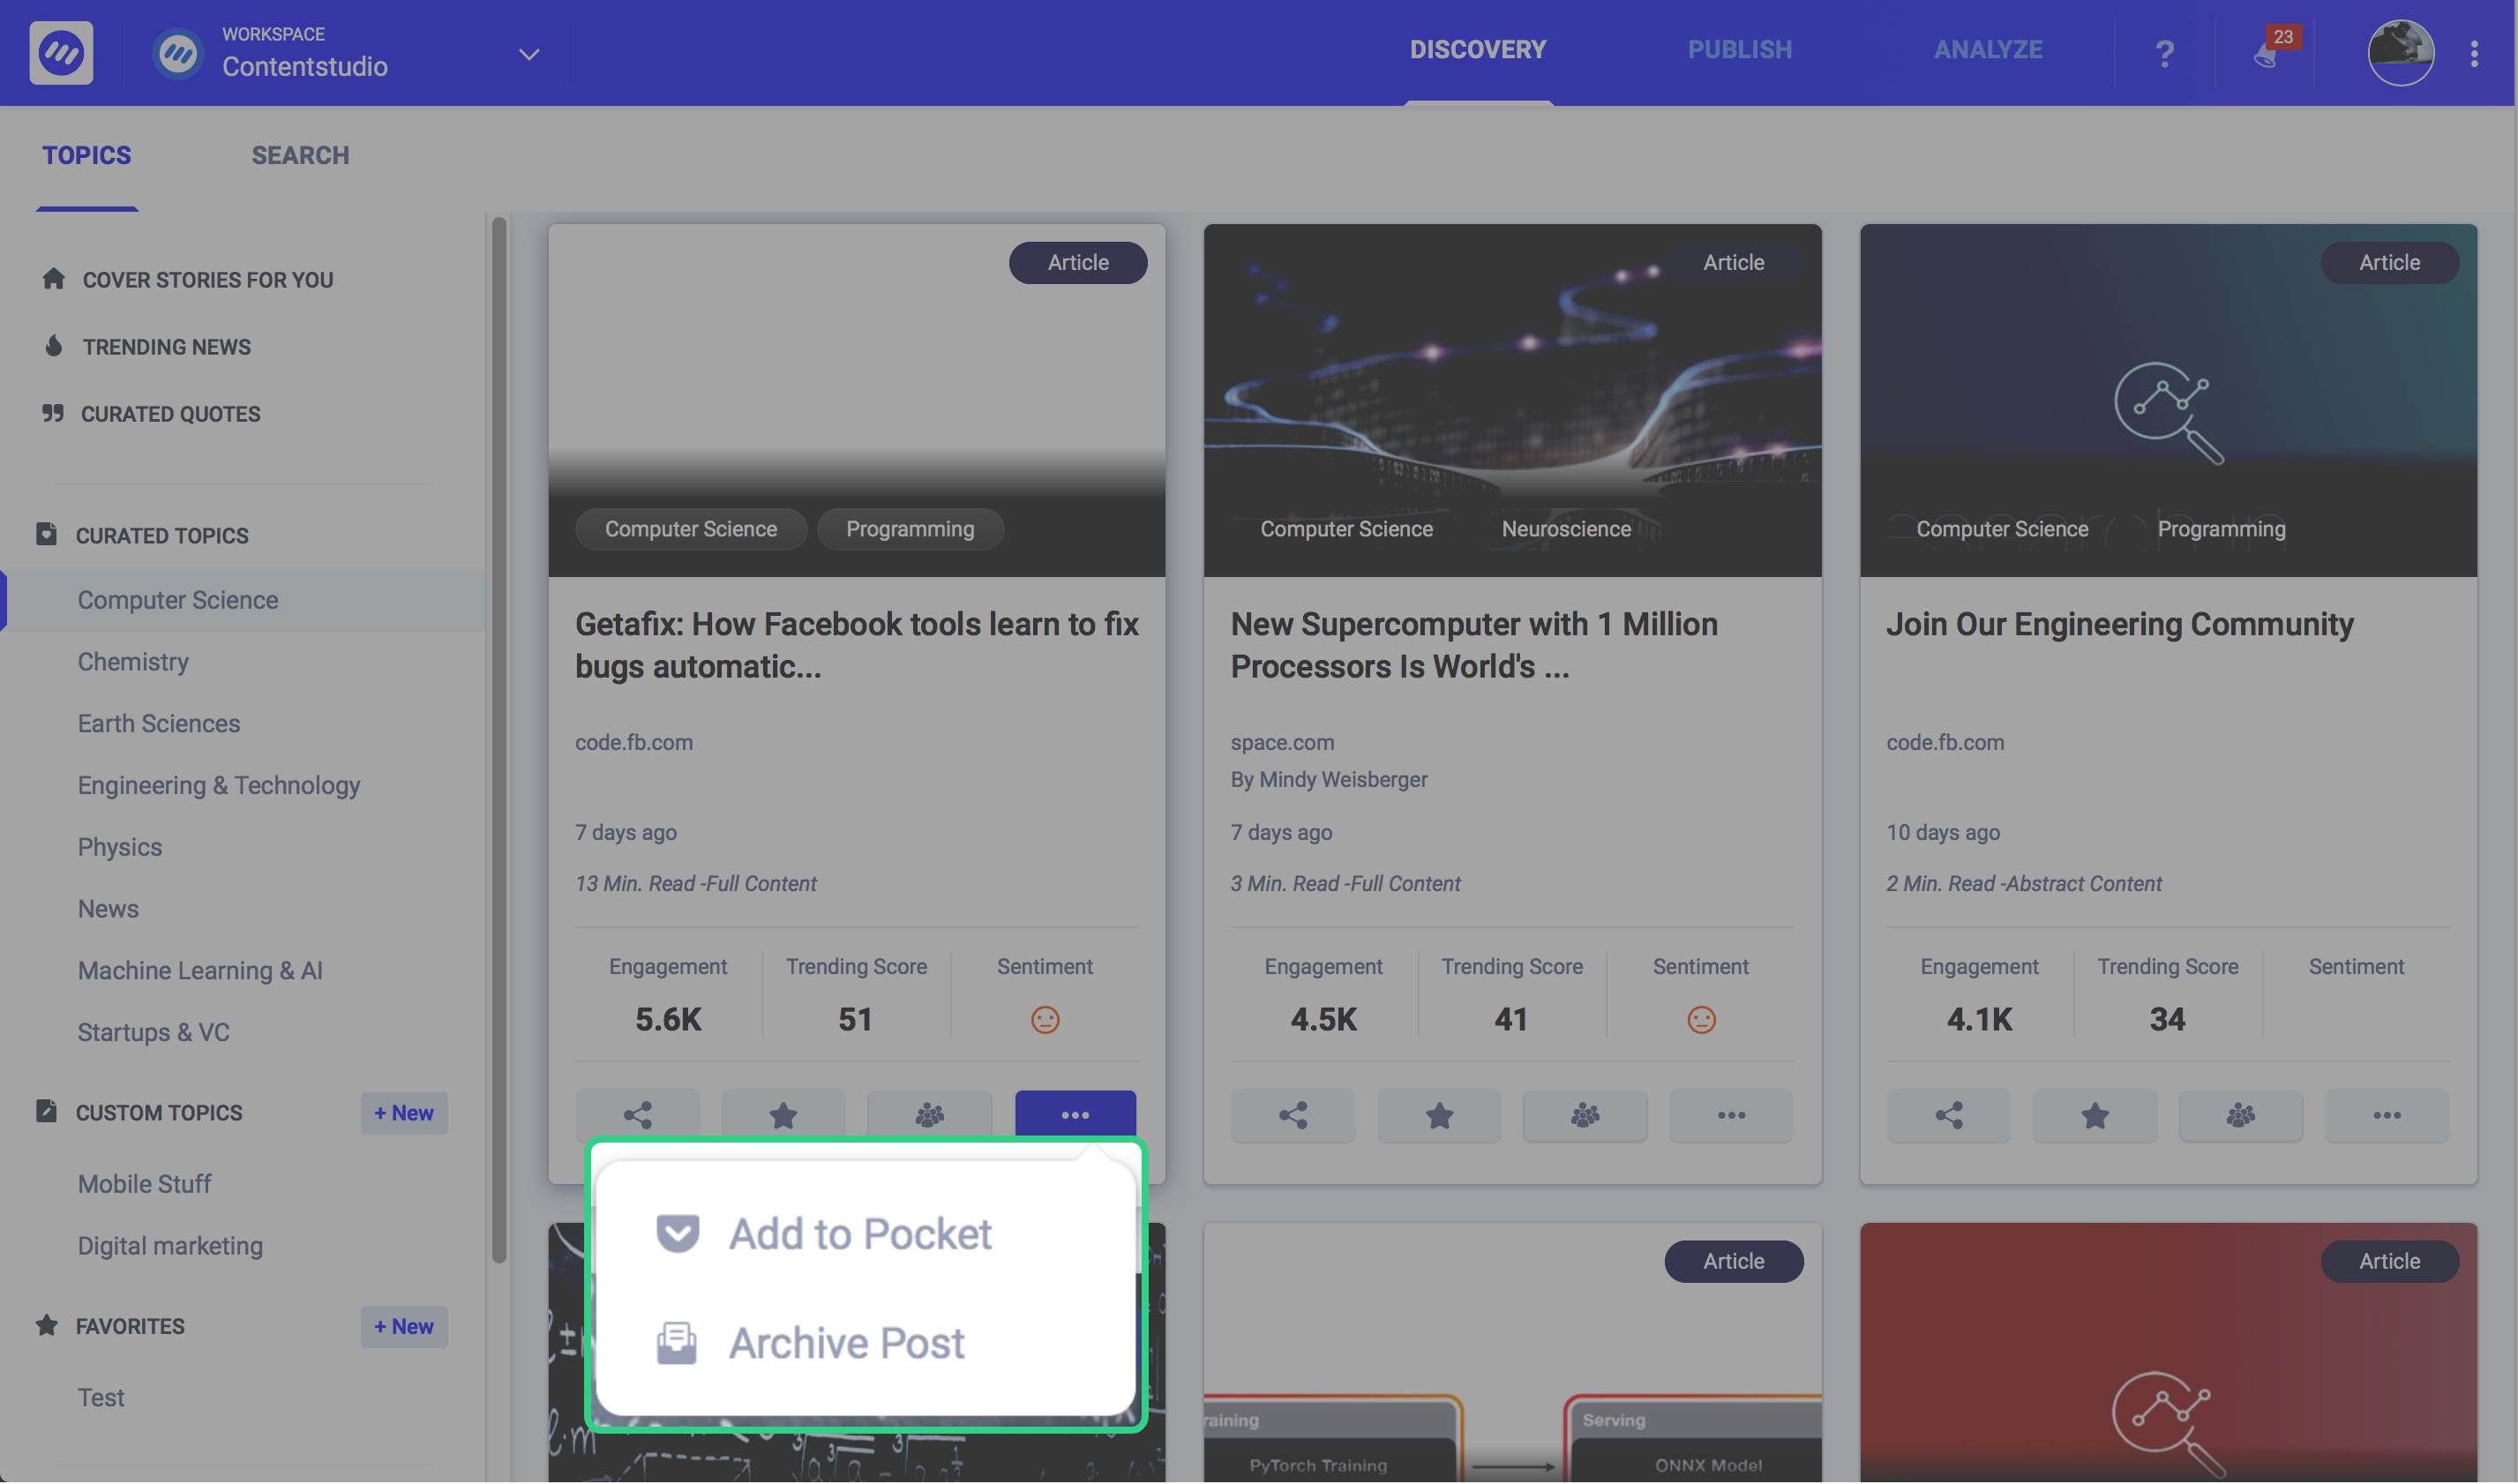
You can also archive the news in the ContentStudio system by clicking on archive post.
Mystery Box
We sincerely hope you liked the new Discovery. We have planned to reveal such insights for all of our major modules. In the next edition, we will be discussing “Composer” and so on so forth.
Recommended for you


Powerful social media management software
14-day free trial - No credit card required.
