
LinkedIn Company page guide: How to create, optimize, and grow it
Sep 24, 202621 minutes

Written by
Arooj IshtiaqUpdated
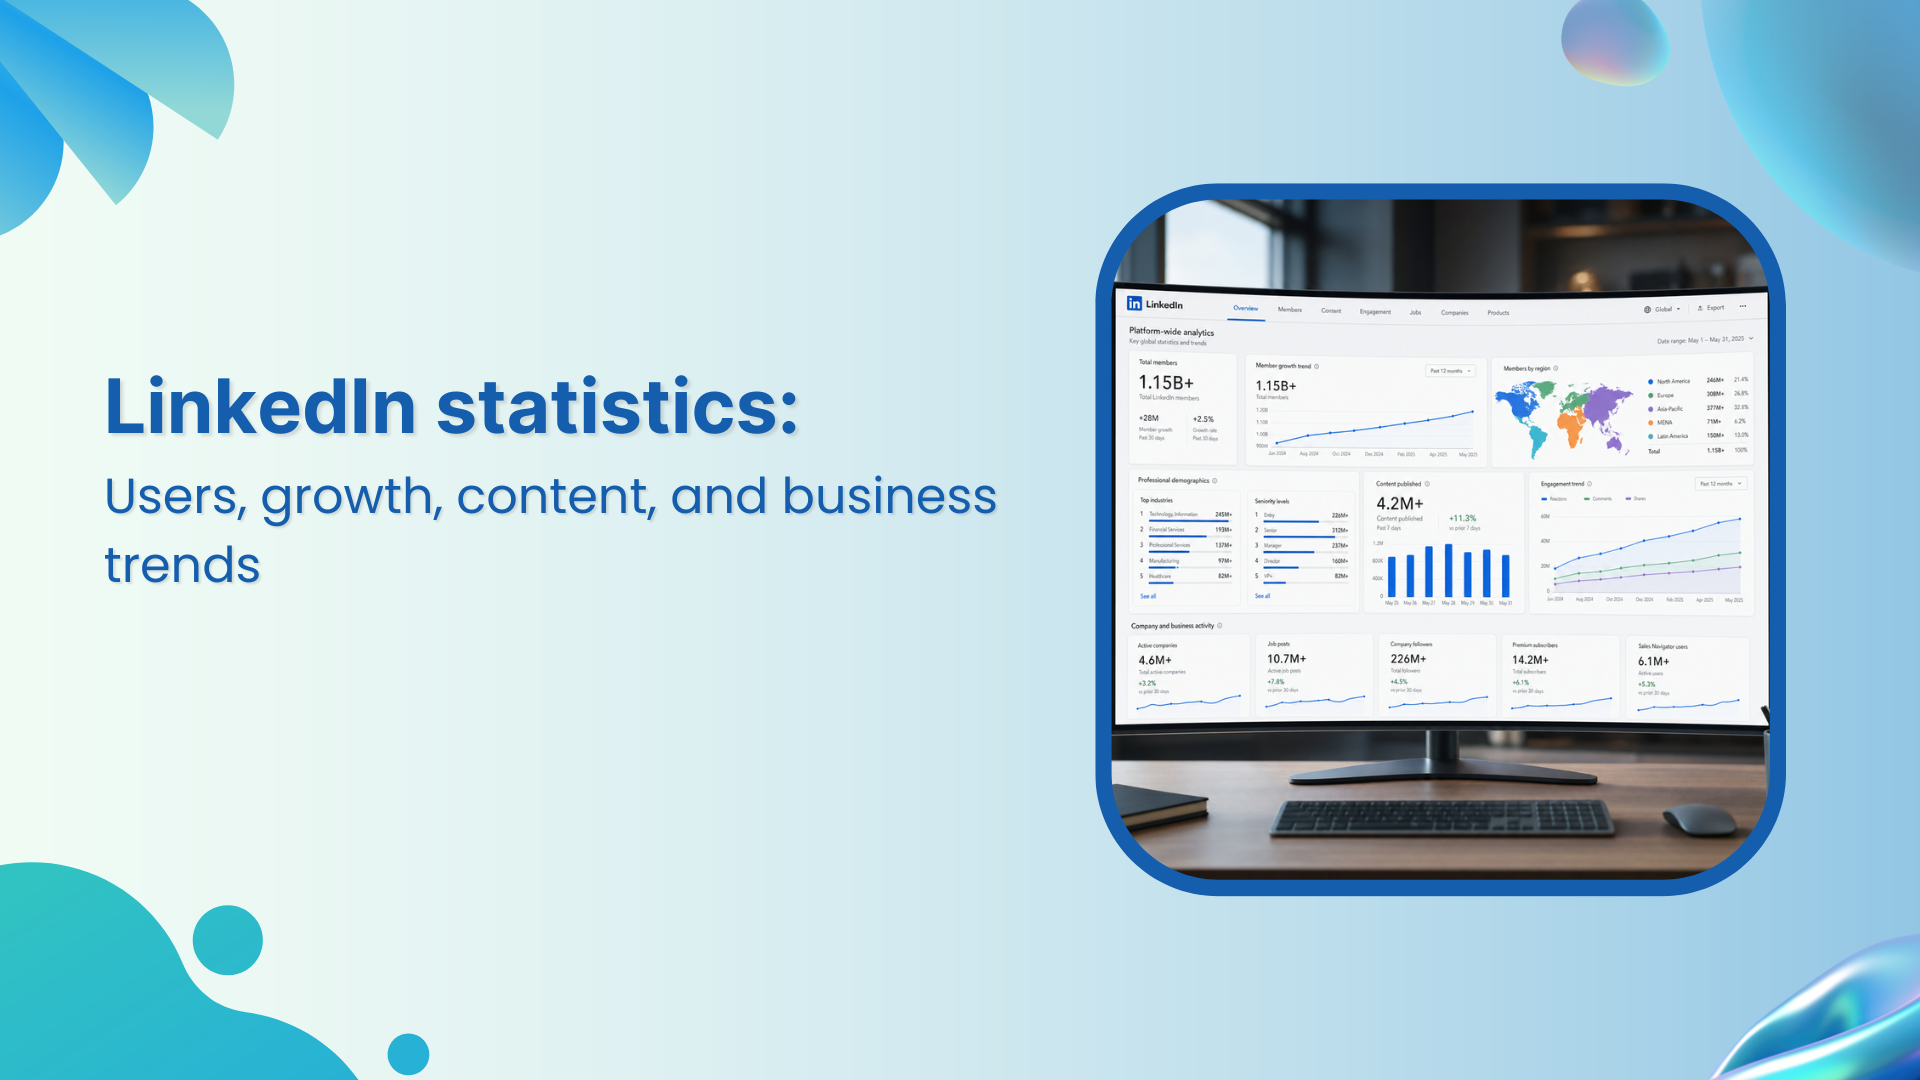
LinkedIn statistics are useful when they help a business understand the scale, professional context, and changing behavior of the platform. They stop being useful the moment they get treated as universal proof that every company should use the same tactic. Clear planning your LinkedIn marketing helps turn platform-level data into decisions about awareness, demand generation, hiring, employer brand, or professional relationships. Teams also need a repeatable way to turn those decisions into consistent activity, and a LinkedIn scheduling tool can support the editorial calendar, review process, publishing rhythm, and reporting workflow behind that work.
LinkedIn remains the largest professional network by membership. Its scale matters, but the more practical question is whether the platform contains the specific people, companies, roles, and conversations relevant to your organization. This article separates current, source-dated LinkedIn statistics from assumptions, projections, and generic benchmarks that should not drive a strategy on their own.
LinkedIn reported more than 1.3 billion members in its Q3 FY26 business highlights, published in April 2026. In the same update, LinkedIn said original posts had grown 14% year over year, and knowledge-oriented comments had risen 11% year over year. LinkedIn’s Q3 FY26 business highlights also reported that paid video had grown nearly 30% year over year.
LinkedIn’s Q4 FY26 update, published in July 2026, reported $19.8 billion in full-year revenue, with revenue up 12% year over year in Q4. LinkedIn also said global membership had increased at a double-digit rate for the fifth consecutive year, time spent on content had grown 10% year over year, knowledge-oriented posts had increased 24%, and time spent reading comments had risen 18%. (LinkedIn’s Q4 FY26 business highlights)
The table below summarizes the headline figures from both updates before the article looks at what each one does, and does not, tell a business.
| Metric | Figure | Reporting period |
|---|---|---|
| Total members | More than 1.3 billion | Reported April 2026 (Q3 FY26) |
| Original posts | +14% year over year | Q3 FY26 |
| Knowledge-oriented comments | +11% year over year | Q3 FY26 |
| Paid video | Nearly +30% year over year | Q3 FY26 |
| Full-year revenue | $19.8 billion | FY26, reported July 2026 |
| Quarterly revenue growth | +12% year over year | Q4 FY26 |
| Time spent on content | +10% year over year | Q4 FY26 |
| Knowledge-oriented posts | +24% year over year | Q4 FY26 |
| Time spent reading comments | +18% year over year | Q4 FY26 |
| Marketing Solutions revenue | +16% year over year (7th straight quarter of double-digit growth) | Q4 FY26 |
| Companies using AI hiring tools | More than 20,000 companies | Q4 FY26 |
These figures show continued growth in membership, business revenue, professional knowledge-sharing, and content consumption. They do not, however, mean that every account will see the same reach, engagement, or commercial result. Account-level outcomes depend on audience fit, message quality, distribution, offer, timing, and follow-up.
Membership is the widest measure of LinkedIn’s scale. It represents registered members, not the number of people who are active in a particular month, the number who see a specific post, or the number who are available to an advertiser.
LinkedIn reported more than 1.3 billion members in April 2026. This is the most useful high-level measure of the platform’s global scale, but it should not be confused with monthly active users, daily active users, or advertising audience estimates. (LinkedIn’s Q3 FY26 business highlights)
Avoid repeating unverified claims that LinkedIn has a specific number of monthly active users unless LinkedIn directly publishes a current figure with a clear definition. Many third-party statistics roundups mix registered membership, web visits, mobile use, and advertising reach, even though they measure different things.
LinkedIn’s business materials describe the platform as having members across regions, industries, seniority levels, company sizes, and job functions. More than 80% of members are outside the United States, and LinkedIn is available in 36 languages. LinkedIn has also stated that its audience includes more than 130 million decision-makers. ( LinkedIn’s B2B audience data)
For a business, the practical implication is not that every market is equally accessible. It is that audience definition matters. A company should identify the roles, account types, industries, locations, and professional situations it wants to influence before using aggregate statistics to justify investment.
The platform’s total membership should not be used as a proxy for the number of people who see your work. Your own LinkedIn reach depends on whether the right people encounter a specific post, comment, Page, profile, newsletter, event, employee perspective, or paid campaign.
A 1.3-billion-member platform can still be the wrong channel for a business if its intended buyers, candidates, partners, or community are not active or reachable in the relevant professional context.
LinkedIn’s business growth helps explain why the platform continues to attract investment from marketers, recruiters, sales teams, creators, and professionals. It also shows that LinkedIn is more than a recruitment site: its revenue comes from multiple products serving hiring, marketing, selling, learning, and subscriptions.
LinkedIn reported full-year FY26 revenue of $19.8 billion and 12% year-over-year revenue growth in Q4 FY26. This figure reflects the scale of LinkedIn’s business, but it is not a measure of advertising revenue alone. (LinkedIn’s Q4 FY26 business highlights )
Microsoft identifies LinkedIn’s principal monetized offerings as Talent Solutions, Marketing Solutions, Premium Subscriptions, and Sales Solutions, which explains why LinkedIn is used across multiple business functions rather than only as a publishing channel.
LinkedIn said Marketing Solutions revenue grew 16% year over year in Q4 FY26, its seventh consecutive quarter of double-digit growth. The update also stated that Premium continued to grow at a double-digit rate.
This does not mean that advertising is automatically the right choice for every business. It does show that organizations continue to invest in reaching professional audiences through LinkedIn’s marketing products, particularly where targeting, campaign objectives, and business measurement are clearly defined.
LinkedIn reported that recruiters at more than 20,000 companies were using its AI-powered hiring solutions in Q4 FY26. It also said seats across its enterprise AI-powered hiring products had increased 140% quarter over quarter.
For recruiting teams, this is a reminder that LinkedIn activity should be connected to the wider hiring process. Content and employer-brand activity can create awareness, but the candidate experience, job description, recruiter follow-up, skills matching, and hiring process still determine whether attention turns into applications and hires.
Recent LinkedIn updates point to increased activity around original posts, knowledge-oriented conversations, video, and time spent engaging with content. These are platform trends, not instructions to publish one format at the expense of all others.
LinkedIn reported that original posts grew 14% year over year in Q3 FY26. In the same period, knowledge-oriented comments increased 11% year over year. By Q4 FY26, LinkedIn said knowledge-oriented posts had grown 24%, while time spent reading comments had risen 18% year over year.
The useful interpretation is that professional readers are spending more time around expertise and conversation, which makes specific, well-supported points of view more valuable than generic posting volume. A deliberate LinkedIn content strategy can translate this platform trend into recurring editorial themes that are relevant to a defined audience rather than reacting to every new content format.
LinkedIn said paid video grew nearly 30% year over year in Q3 FY26. Its marketing materials also reported that video creation increased 27% and video views rose 36% over the preceding year.
Video should be used when a demonstration, explanation, speaker perspective, interview, or visual context makes the information more useful. It is not automatically the best choice for every subject: a concise text post may be clearer for a focused opinion, and when the material requires a step-by-step explanation, LinkedIn carousel posts can help readers work through a framework or reference material at their own pace.
LinkedIn reported that posting had grown 41% over three years and CEO posting had increased 52% over two years. More people publishing creates more opportunity for discovery, but it also makes vague, duplicated, and generic content easier to ignore.
The response is not necessarily a higher posting quota. The stronger response is to publish material that reflects direct knowledge, a clear audience problem, a distinctive perspective, or useful evidence.
LinkedIn is especially relevant for organizations that need to communicate in a professional setting. That can include B2B companies, service businesses, employers, recruiters, consultants, creators, education providers, nonprofit organizations, and brands that need to build trust before asking for a commercial action.
LinkedIn states that its membership includes more than 130 million decision-makers. It also reports that 98% of Fortune 500 CEOs use LinkedIn as their primary or only social platform, based on research cited in its marketing materials.
These facts should not be read as a promise that decision-makers will see a particular post. They are a reason to consider LinkedIn when decision-maker visibility is a strategic objective. To create useful exposure, a message still needs to address a relevant role, problem, or decision.
LinkedIn advertising data can show the estimated audience available through Campaign Manager targeting. It should not be described as the platform’s active-user total or total membership.
Marketers should also avoid treating industry averages for CTR, CPC, CPL, engagement rate, conversion rate, or return on ad spend as universal benchmarks, since results vary by market, geography, campaign objective, creative, targeting, offer, landing page, sales cycle, attribution model, and how a business defines a qualified lead. A disciplined LinkedIn performance metrics framework helps separate awareness signals, traffic, lead-form activity, qualified conversations, and pipeline evidence instead of treating every interaction as commercial success.
Organic LinkedIn activity can build familiarity, credibility, and recurring professional attention over time. Paid campaigns can deliver a defined message to selected audiences with greater control over targeting, budget, and campaign objectives.
The two approaches can reinforce each other, but they should be reported separately. An organic post may be judged by relevance and conversation quality; a paid lead campaign may need to be judged by lead quality, pipeline contribution, and cost. Combining them into one raw-reach total can obscure what actually worked.
Platform statistics should inform a hypothesis, not replace strategy. Use them to understand the environment, then validate decisions with evidence from your own audience and account activity.
Start with a question that a number can help answer:
A clear question prevents a team from reporting platform size when it should be evaluating message relevance or follow-up quality.
Broad statistics explain context; your own performance data explains whether the approach works for you. Review members reached, impressions, clicks, profile or Page visits, follows, meaningful comments, reposts, website activity, qualified conversations, and business outcomes according to the objective. A reliable LinkedIn analytics process can connect these signals across posts, Pages, profiles, and reporting periods, and makes it easier to compare similar activity rather than drawing conclusions from one unusually high or low post.
Platform statistics cannot compensate for a weak Page or profile. When someone discovers a post, the destination should make it clear who the organization serves, what it knows, and what a visitor can do next. A well-structured LinkedIn business page helps companies turn new visibility into more useful followership, resource discovery, and brand understanding. Individual experts need the same clarity: their headline, About section, featured work, and experience should explain why their perspective is worth following.
Statistics can strengthen an article, post, presentation, or campaign when they are directly relevant and appropriately sourced. A good practice is to include the source, the publication date, the population measured, and the definition of the metric.
For example, “LinkedIn reported more than 1.3 billion members in April 2026” is specific and attributable. “LinkedIn has 1.3 billion active users” is inaccurate because membership and active use are different measures.
Avoid using a statistic just because it appears impressive. The number should help explain a decision, provide context, or support a point that readers need to understand.
Many older LinkedIn statistics continue to circulate in search results and presentations. They may be outdated, unsupported, or based on a different measurement scope.
LinkedIn does not regularly publish a current global monthly active user figure in the same way some consumer social platforms do. Do not convert membership numbers, website visits, or advertising audience estimates into an active-user statistic.
Claims that a particular word count, day, time, image count, or posting frequency always produces the “best” LinkedIn engagement should be treated with caution. Performance is shaped by topic relevance, audience relationship, content quality, format, distribution, and competition for attention.
Creator Mode should not be described as a current LinkedIn growth feature. It was retired, and current LinkedIn features, analytics availability, and publishing tools can differ by account type and ongoing product updates.
Historical ad-reach figures are not current membership data. Advertising reach also represents an estimate of people an advertiser could potentially target, not a count of every active member or person who will see an ad.
Use this checklist when citing LinkedIn data or using it to make a business decision.
LinkedIn’s current statistics show a platform that continues to grow in membership, revenue, original publishing, professional discussion, video activity, and business adoption. Its reported scale, more than 1.3 billion members, makes it strategically relevant for many organizations, especially those that need to reach people in a professional context.
But scale alone is not a strategy. The meaningful question is whether a business can create useful visibility among the specific people it needs to influence. That requires clear positioning, relevant content, credible participation, a useful destination, and measurement that connects activity with real outcomes.
LinkedIn monetizes through Talent Solutions, Marketing Solutions, Premium Subscriptions, and Sales Solutions. Its reported revenue therefore includes more than advertising.
LinkedIn’s marketing materials stated in 2026 that the platform had 69 million companies. This is a company-presence figure, not a guarantee that every company is active or regularly publishing.
Yes, when they are used as context rather than a substitute for account-level evidence. Platform statistics can help assess the opportunity, while your own reach, audience quality, clicks, qualified conversations, and business outcomes determine whether the strategy is working.
No. More publishing can create more opportunities to learn, but frequency does not guarantee relevant reach or business impact. Prioritize useful content for a defined professional audience and use a sustainable rhythm that leaves room for research, response, and review.
No platform statistic can prove ROI for an individual advertiser. Measure campaign performance using the objective, audience quality, spend, conversion path, sales cycle, attribution approach, and CRM or revenue evidence that apply to your business.
Use directly relevant, current, attributable figures. Explain what the statistic measures and avoid implying more than the source supports. Membership, revenue growth, content activity, or audience composition can provide useful context when the statistic genuinely helps the reader understand the argument.
Plan 0 Days of Content in 0 Minutes
Create, schedule, publish and analyze your content across all your social media channels from one simple dashboard.
4.7 on Capterra • 16,500+ marketers trust ContentStudio
Arooj Ishtiaq is a Content Marketing Strategist with 5+ years of experience writing about social media, SaaS, and AI. At ContentStudio, she creates practical guides, tutorials, and how-to content that help marketers navigate social media trends, sharpen their strategies, and get more from their content.
View all posts by Arooj IshtiaqRecommended for you
LinkedIn Company page guide: How to create, optimize, and grow it
LinkedIn marketing in 2026: Strategy, content, and growth

How to see scheduled posts on LinkedIn | Step-by-step

How to Use LinkedIn Hashtags Without Overdoing It