LinkedIn Company page guide: How to create, optimize, and grow it
Sep 24, 202621 minutes

Written by
Arooj IshtiaqUpdated
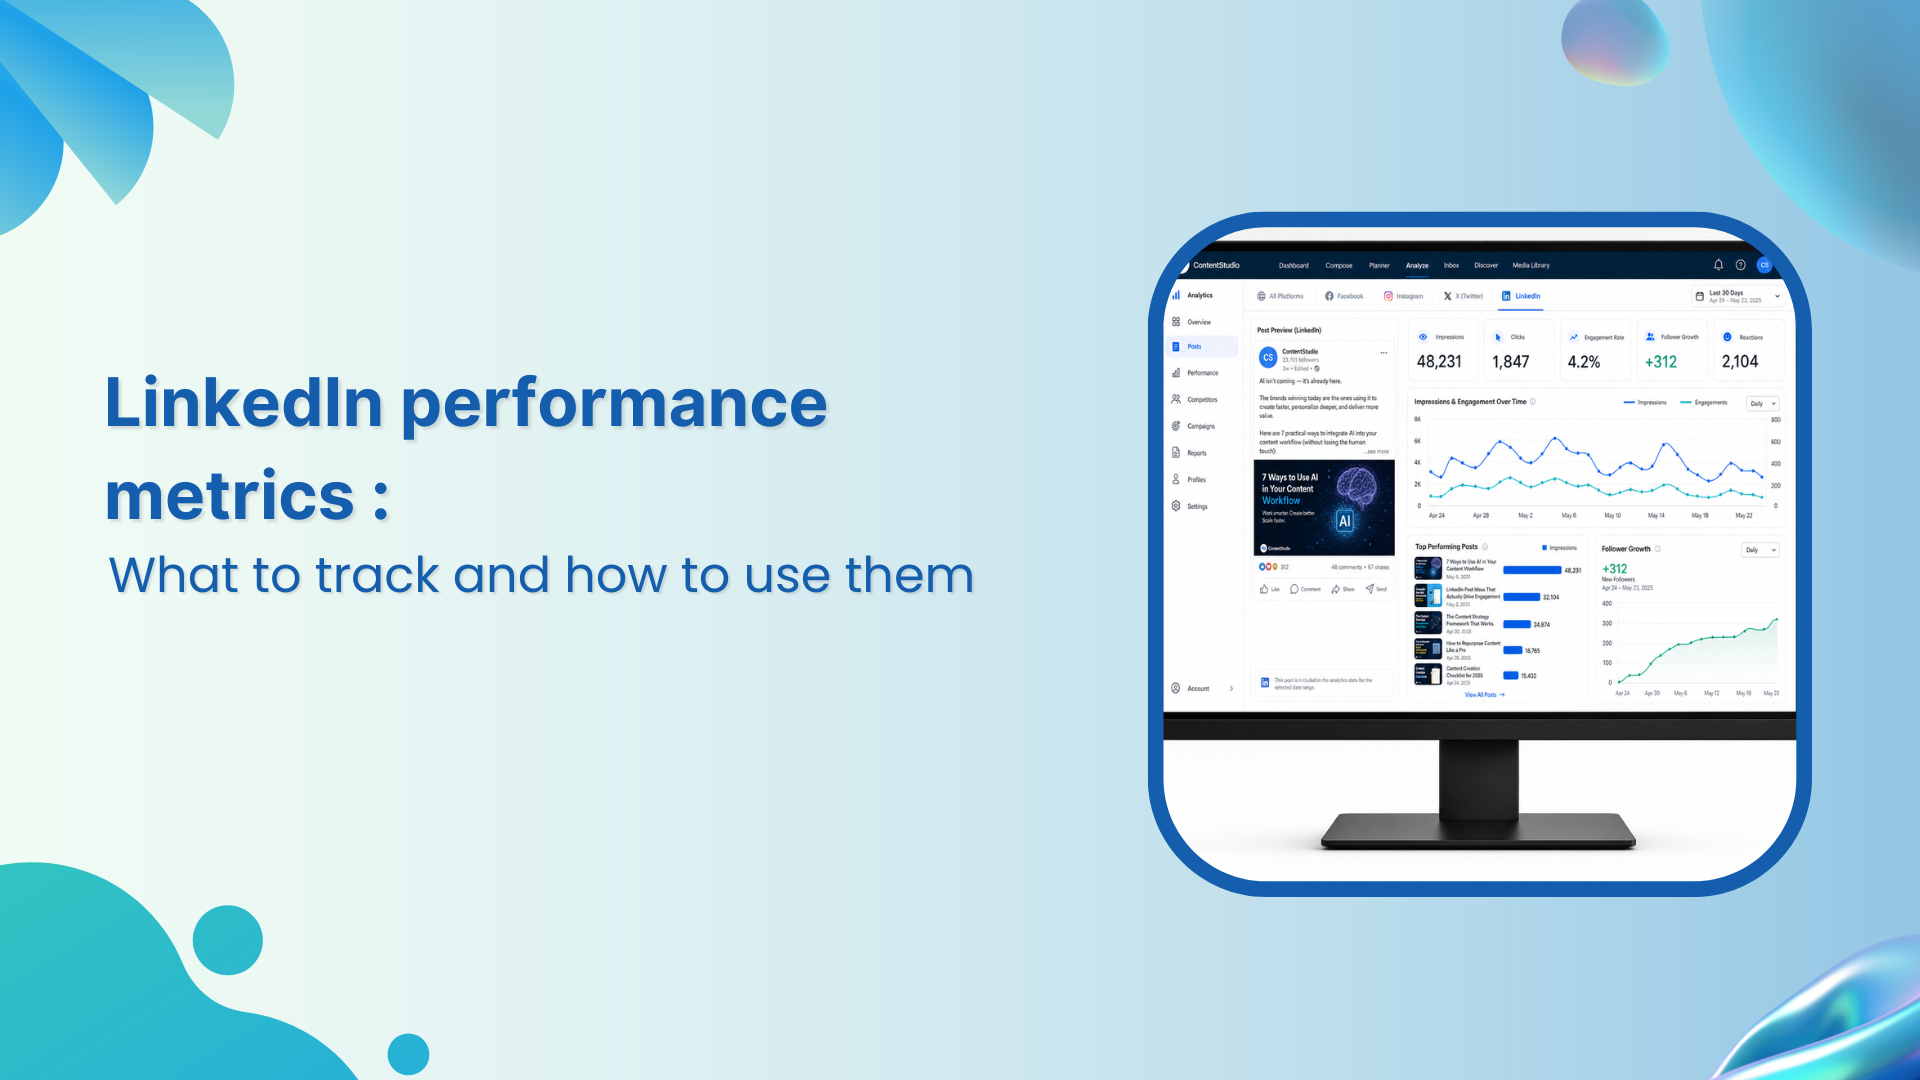
LinkedIn performance metrics can fill a dashboard without answering the question that matters: did the work help the business become more visible to the right people and move them toward a useful next step? Impressions, reactions, comments, clicks, follower growth, and leads are signals. None is a complete measure of success on its own.
Start by deciding what LinkedIn needs to contribute to your broader LinkedIn marketing plan. Once objectives are clear, performance reporting becomes a way to improve decisions rather than a monthly list of isolated totals. If the team also needs a repeatable way to coordinate publishing, approvals, and reporting, a LinkedIn scheduler keeps the operating process connected so measurement never becomes an afterthought.
Use these principles to decide which LinkedIn numbers deserve attention and what each one can, and cannot, tell the team.
LinkedIn performance metrics are the measurements used to understand how content, a Page, a profile, or a paid campaign performs. They can show whether content was displayed, whether people interacted with it, whether a Page gained followers or visitors, and whether people submitted lead forms in paid campaigns.
For Page admins, LinkedIn’s analytics areas include Content, Followers, Visitors, Search appearances, Competitors, Employer brand, and Newsletter analytics. Availability can vary by Page, product, role, feature rollout, and whether content is organic or sponsored. Treat dashboard fields as platform-reported estimates and use the definitions shown in the account when preparing a formal report. Reviewing these areas together, instead of one dashboard at a time, is easier with a consistent analytics process that ties post, profile, and Page data into one system.
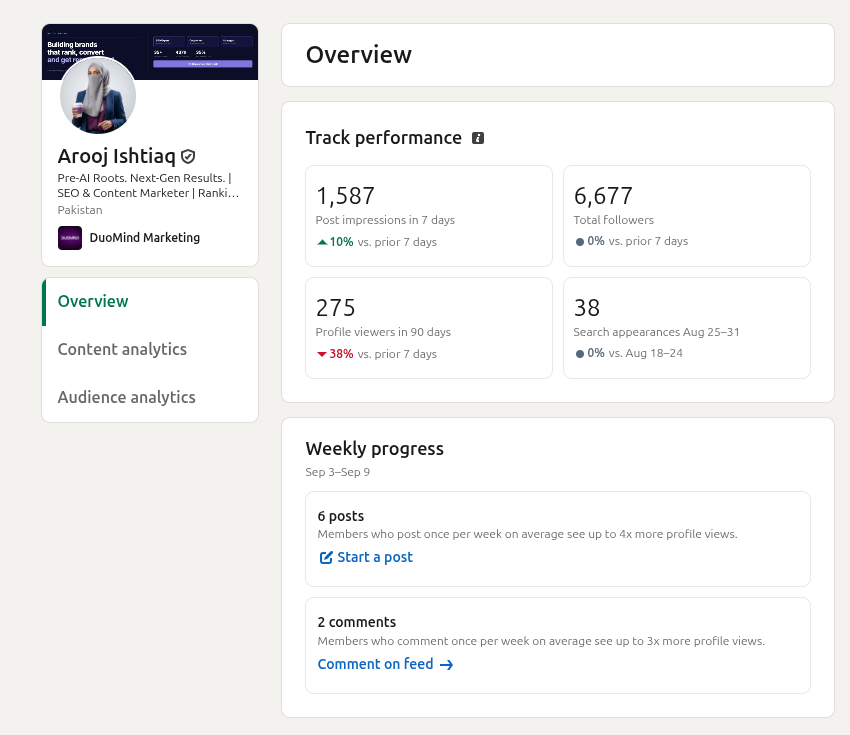
The same metric can mean different things in different contexts. A high-impression awareness post, for example, should not be judged by the exact standard used for a lead-generation campaign. The framework below matches each objective with evidence that helps a team make an informed decision.
| Objective | Primary evidence | Useful supporting evidence | What not to assume |
|---|---|---|---|
| Awareness | Members reached and impressions | Audience demographics, search appearances, relevant reposts | More impressions automatically mean qualified awareness |
| Engagement and trust | Thoughtful comments, reposts, saves where available, engagement rate | Repeat discussion from relevant professionals, profile or Page visits | A high reaction count means commercial intent |
| Traffic and consideration | Clicks, CTR, website sessions, content consumption | Landing-page behavior, resource downloads, returning visitors | A click is a qualified lead |
| Audience growth | New followers and follower demographics | Sources of followers, Page visits, profile visits | A larger follower count means a better audience |
| Demand generation | Lead-form completions, qualified conversations, pipeline context | Cost per lead, contact-form completion rate, CRM disposition | Platform leads are all sales-ready |
A useful dashboard contains enough detail to explain a result, but not so many numbers that the team loses sight of the objective. The core metrics below are most useful when compared across similar posts, consistent date ranges, and the same type of distribution.
| Metric | What it measures | How to use it well |
|---|---|---|
| Impressions | Estimated number of times a post was shown on LinkedIn. One person can create more than one impression. | Use as a distribution measure. Compare similar format, audience, paid status, and period. |
| Members reached | Estimated number of distinct members and Pages that saw a post; repeat displays are excluded. | Use to understand unique exposure and compare audience discovery with impression volume. |
| Clicks | Clicks on content, company name, or logo by signed-in members. Reactions, comments, and reposts are excluded. | Use with CTR and downstream site behavior to assess whether the next step was compelling. |
| CTR | Clicks divided by impressions. | Compare similar posts and destinations. A high CTR can still send unqualified traffic. |
| Engagements | The total interactions on a post, including clicks, reactions, comments, and reposts. | Inspect components. A comment from a target buyer may be more useful than many low-context reactions. |
| Engagement rate | Interactions divided by impressions; interactions include clicks, reactions, comments, and shares/reposts. | Use as a normalized comparison, not as a universal benchmark or a substitute for outcomes. |
| Reactions, comments, reposts | Visible forms of audience response and, for reposts, potential additional distribution. | Read qualitative signals: who responded, what they said, and whether the conversation fits the objective. |
| Video views and time viewed | For video reporting, views longer than two seconds and the cumulative duration watched. | Use alongside clicks, audience information, and the video’s intended action; a two-second view is not completion. |
| Page visitors and custom-button clicks | Evidence that people visited the Page and, where configured, acted on its custom button. | Review visitor source and demographic patterns, then make the Page clear about expertise, proof, and next steps. |
| Followers and new followers | Page followership and changes over time; LinkedIn offers demographic breakdowns such as location, seniority, job function, industry, and company size. | Focus on growth among relevant audiences, not total count alone. |
| Leads and cost per lead | For eligible boosted content, leads reflect people who submitted a lead-gen form; cost per lead estimates spend per lead. | Use CRM qualification and pipeline feedback before scaling a campaign. |
Reading impressions next to members reached, as part of a consistent LinkedIn reach review, keeps unique exposure and repeat display from being reported as the same result. Once the raw numbers are sorted, the next step is analyzing what that reach actually represents.
A rate or total can identify a pattern, but it cannot tell you whether attention came from the right audience. Define the audience in plain language before the reporting period, for example, operations leaders at mid-market manufacturers in a defined region, customers using a specific workflow, or qualified candidates for a technical role.
Audience fit turns visibility into useful attention. Look for signals that target roles, accounts, and professional communities are actually seeing and responding to the work.
This is also where a well-built LinkedIn business page pays off, since clear positioning and proof content directly shape who chooses to follow once they land there.
Use tagged links and web analytics to distinguish LinkedIn traffic, then examine landing-page engagement and conversion quality. Ask sales, customer-success, recruiting, or community teams whether recurring interactions are appearing in real conversations, and keep the destination itself aligned with a clear content strategy for LinkedIn so the topic, format, and expected action all point in the same direction.
Formulas help compare work fairly, but label custom calculations clearly. Do not mix a platform-reported rate with a custom rate without explaining the difference. The following formulas are practical internal measures, not universal performance benchmarks.
| Metric | Formula | Interpretation |
|---|---|---|
| Engagement rate | (Clicks + reactions + comments + reposts) ÷ impressions × 100 | LinkedIn’s Page definition uses interactions per impression. It helps compare distribution-normalized responses. |
| Click-through rate (CTR) | Clicks ÷ impressions × 100 | Shows the proportion of impressions that led to clicks. Review destination quality before treating it as success. |
| Follower growth rate | New followers during period ÷ followers at start of period × 100 | Shows growth relative to the base. Pair it with follower demographics. |
| Reach-to-follow conversion | New followers attributable to a post or period ÷ members reached × 100 | A directional internal measure. Attribution is imperfect because a member may follow after several touchpoints. |
| Reach-to-conversation conversion | Qualified conversations started ÷ members reached × 100 | Useful for B2B teams when “qualified conversation” is defined before reporting. |
| Lead-form completion rate | Submitted lead forms ÷ members who clicked into the form × 100 | LinkedIn provides this for eligible boosted lead-gen activity. It reflects form completion, not sales qualification. |
A strong measurement program does not assume every message belongs on the Company Page. Personal profiles are often more appropriate for individual experience and professional judgment. The Page should provide official brand context, resources, and a reliable destination. Employee participation can extend a useful idea into relevant networks when people add their own genuine expertise.
| Publishing layer | Primary role | Metrics to examine |
|---|---|---|
| Personal profile | Build trust through an individual point of view and direct professional interaction. | Relevant profile views, connection requests, comments, reposts, inbound messages, and referred visits. |
| Company Page | Create a durable brand destination and publish official resources, product context, events, and updates. | Impressions, members reached, clicks, Page visitors, followers, custom-button clicks, and content quality. |
| Employee expertise | Add credible role-specific context and reach distinct professional networks. | Audience overlap, relevant conversations, referred visits, follower quality, and whether amplification adds new insight. |
| Paid campaign | Deliver a defined message to a selected audience with budget and targeting controls. | Impressions, CTR, lead-form completion, leads, cost per lead, quality, and pipeline context. |
Deciding how much weight each layer carries is itself a content-strategy decision, not just a measurement one, so revisit it whenever the mix of personal, Page, employee, and paid activity shifts.
Avoid asking employees to copy a central caption verbatim. Instead, give them accurate source material, a clear subject, and optional proof points, then let each contributor explain what the topic means in their own role. This reduces duplication and gives readers a reason to engage with more than one version of an idea, especially when the effort is treated as part of an integrated using LinkedIn for businesses approach that connects employee voices with Company Page activity.
Reach becomes more valuable when a first-time viewer has a clear reason to stay connected. This is why post performance and Page or profile quality should be reviewed together. A useful post may introduce the brand, but the destination must explain who the organization helps, what it knows, and what a visitor should do next.
New followers are most valuable when they are likely to care about future updates. Make it easy for a visitor to understand why the Page or profile is worth following, and do not rely on generic calls to action.
For B2B teams, define “qualified conversation” before measuring it. For example, it might be a response from a target account that includes a relevant challenge, request, or consent to continue. This prevents a high volume of low-context messages from being reported as demand, particularly once follow-up moves into relationship-led LinkedIn messages where private conversations need to stay helpful, timely, and grounded in context.
Organic and paid activity can reinforce one another, but they should not be merged into one undifferentiated success number. Organic content helps a brand develop credibility and learn which themes attract relevant attention. Paid distribution provides more control over delivery, targeting, budget, and campaign objectives. Their cost structures, audiences, and expected outcomes are different.
LinkedIn notes that Page content analytics for boosted posts can differ from Campaign Manager because Page analytics includes boosted posts appearing in the feed, while Campaign Manager can include other ads and offsite views. Use the reporting environment that matches the question, and state the source of the figure in stakeholder reports.
Do not judge every post at the same hour after publication. Some posts create immediate discussion; others continue to attract visibility through reposts, search, newsletter distribution, documents, video viewing, or later visits to the Page. Use a consistent review window for comparable content, then add a longer lookback for evergreen pieces.
| Stage | What to review | Decision to make |
|---|---|---|
| Before publishing | Objective, intended audience, message, format, destination, measurement tags, owner for replies. | Whether the post has a clear job and a trackable next step. |
| Early response | Initial comments, audience fit, clicks, technical issues, and whether questions need a timely answer. | Whether to respond, clarify, or support useful discussion. |
| Comparable review window | Impressions, members reached, engagement rate, CTR, engagement quality, Page or profile response. | Whether the idea, framing, format, or destination performed comparatively well. |
| Extended lifecycle | Reposts, recurring visits, website behavior, qualified conversations, follower impact, and campaign results. | Whether to update, repurpose, reintroduce, or retire the topic. |
| Monthly synthesis | Patterns across themes, formats, audience segments, publishing layers, and paid vs. organic work. | One focused test for the next cycle. |
Some evergreen ideas remain useful long after their first publication. In those cases, scheduling a repeat post on LinkedIn can extend the content’s value without making the feed repetitive, provided the framing or supporting evidence is refreshed for the new audience seeing it.
A weak result is not a diagnosis. Use the pattern, the context, and comparable past activity to decide what needs attention. The table below is designed to help teams investigate before they change several variables at once.
| Pattern | Questions to investigate | Useful next action |
|---|---|---|
| Impressions or members reached decline | Did audience fit change? Is the topic repetitive? Did the mix of formats, Page activity, or paid support change? | Review comparable posts, recent themes, and publishing layers. Test one clearer audience-specific angle. |
| High impressions, weak engagement | Is the message too broad? Does it offer a reason to respond, save, or explore? Is the audience relevant? | Tighten the point of view and examine comment quality, clicks, and audience composition rather than only reactions. |
| Good engagement, weak CTR | Was the post designed for discussion rather than traffic? Is the destination unclear, weak, or poorly matched? | Clarify the value of the next step and inspect the landing page. Do not force a link into every post. |
| Clicks but poor website outcomes | Does the landing page deliver on the post’s promise? Are visitors qualified? Is page speed, form length, or tracking the issue? | Check UTM-tagged sessions, engagement, conversion path, and CRM feedback. |
| Follower growth stalls | Does the Page or profile provide a compelling reason to follow? Are relevant themes and employee voices consistent? | Improve destination clarity, build repeatable themes, and inspect follower demographics. |
| Many leads, low quality | Are targeting, offer, lead form, and qualification criteria aligned? | Review lead sources and CRM disposition; refine audience, offer, form fields, and follow-up process. |
| Strong activity, few conversations | Is the team identifying and responding to relevant participants? Are calls to action appropriate for the relationship stage? | Define qualified conversation, assign response ownership, and use helpful context-led follow-up. |
A consistent monthly routine keeps reporting manageable and makes learning cumulative. Use it as a starting point, then adjust the cadence to publishing volume, campaign length, and the team’s capacity to act on insights.
| Week | Action | Output |
|---|---|---|
| Week 1 | Set objectives, audience definitions, baseline metrics, tracking links, and reporting owners. | A measurement brief and baseline dashboard. |
| Week 2 | Publish within established themes; monitor early questions and relevant interactions. | Post notes that capture audience signals, not just totals. |
| Week 3 | Test one variable: opening, format, publishing layer, destination, or audience angle. | A controlled comparison rather than unrelated changes. |
| Week 4 | Review post, Page, website, and business evidence; separate organic and paid results. | A concise stakeholder summary with one learning and one next test. |
A useful report should answer four questions: Did we reach more of the right people? Did they show meaningful interest? Did that interest contribute to an intended outcome? What will we test next? Avoid presenting a large spreadsheet without narrative, context, comparison period, or decision.
| Stakeholder question | Evidence to include |
|---|---|
| Did visibility improve? | Impressions and members reached trend, organic vs. paid split, and discovery outside the immediate audience. |
| Was the audience relevant? | Follower and visitor demographics where available, target-account or role signals, and quality of comments or conversations. |
| Did content create curiosity? | Clicks, CTR, Page or profile visits, custom-button clicks, follows, saves where available, and meaningful replies. |
| Did it support an outcome? | Tagged website behavior, event registrations, resource activity, lead-form results, qualified conversations, hiring evidence, or pipeline context. |
| What will change next? | One theme, format, publishing layer, destination, targeting choice, or follow-up process to test. |
Use this checklist before closing the reporting period or planning the next cycle. It keeps the conversation focused on audience value and learning rather than volume alone.
LinkedIn performance metrics become useful when they help a team make a better decision. A report that only ranks posts by impressions or reactions may identify activity, but it does not show whether the organization is building relevance, trust, consideration, or qualified demand.
Measure distribution, response, audience quality, traffic, and outcomes as connected parts of a journey that ladders back up to the LinkedIn marketing plan set at the start of the cycle. Then compare similar work, keep organic and paid activity distinct, and use each reporting cycle to improve one clear element of the next. That turns LinkedIn analytics from a scoreboard into a practical learning system.
The best metrics depend on the objective. For Page content, start with impressions, members reached, clicks, CTR, reactions, comments, reposts, and engagement rate. Add Page visitors, follower growth and demographics, web behavior, leads, qualified conversations, and business outcomes when they match the goal.
For LinkedIn Page content analytics, engagement rate is the ratio of interactions to impressions. Interactions include clicks, reactions, comments, and shares/reposts.
No. LinkedIn defines clicks as clicks on content, the company name, or logo by signed-in members; interactions such as reactions, comments, and reposts are excluded from clicks.
Monitor active conversations soon after publishing, review comparable post performance on a consistent schedule, and synthesize themes monthly. The exact cadence should match publishing volume, campaign length, and the team’s ability to act on findings.
Yes. A narrowly targeted post can be successful if it reaches a relevant decision-maker, produces a high-quality conversation, answers a customer question, or supports a measurable next step. Reach is distribution evidence, not a final verdict.
Report them separately first, because their delivery models, costs, targeting controls, and objectives differ. They can be discussed together in the overall customer journey, but raw totals should not obscure the source of performance.
Plan 0 Days of Content in 0 Minutes
Create, schedule, publish and analyze your content across all your social media channels from one simple dashboard.
4.7 on Capterra • 16,500+ marketers trust ContentStudio
Arooj Ishtiaq is a Content Marketing Strategist with 5+ years of experience writing about social media, SaaS, and AI. At ContentStudio, she creates practical guides, tutorials, and how-to content that help marketers navigate social media trends, sharpen their strategies, and get more from their content.
View all posts by Arooj IshtiaqRecommended for you
LinkedIn Company page guide: How to create, optimize, and grow it
LinkedIn marketing in 2026: Strategy, content, and growth

How to see scheduled posts on LinkedIn | Step-by-step
How to Use LinkedIn Hashtags Without Overdoing It