Bulk-generate & schedule posts in seconds with Smart Scheduling. Try now!
20 social media KPIs you need to track to measure success

Social media has become essential for businesses looking to connect with customers, build their brand, and drive sales. But how do you know if your efforts are working? This is where social media KPIs (Key Performance Indicators) come in—these metrics help you measure what’s working and what isn’t.
Using social media without tracking KPIs is like driving without a map or destination. Your business needs clear metrics to understand whether your social media presence delivers accurate results beyond brand awareness. An effective social media strategy can generate engagement, nurture leads, drive website traffic, increase conversions, improve customer service, build loyalty, and ultimately boost revenue.
Simplified social media marketing for individuals & agencies.
Try ContentStudio for FREE
What are social media KPIs?
KPI stands for key performance indicator—the numbers that tell you whether your social media efforts are working or just spinning wheels.
Social media KPIs go beyond counting likes and followers. They’re strategic metrics with clear targets that connect directly to your business goals. While a single metric might look impressive in isolation, the combination of relevant KPIs reveals the complete picture of your social media performance.
These metrics help answer crucial questions:
- Is your content reaching the right people?
- Are followers engaging with your brand?
- Are social platforms driving traffic to your website?
- Most importantly, is any of this activity converting into actual business results?
To track these KPIs effectively, you’ll need business accounts on each platform or a social media analytics tool like ContentStudio that compiles data from multiple networks in one place—saving you from jumping between different platforms to gather insights.
Why is it important to track social media KPIs?
Here’s why tracking social media KPIs is crucial:
- Measure success: Without KPIs, it’s like playing a game without a scorecard. You’re putting in effort but won’t know if you’re actually winning (achieving your goals) on social media. KPIs quantify your performance, clearly showing how your social media strategy is faring.
- Optimize your strategy: Imagine pouring resources into content that gets no traction. Tracking KPIs exposes what content resonates and what falls flat. This allows you to adapt your strategy, focusing on high-performing content types and optimizing for better results.
- Demonstrate ROI: Social media marketing requires investment. KPIs provide data-driven evidence to prove your social media efforts’ return on investment (ROI). This is essential for justifying budget allocation and securing buy-in from stakeholders.
- Align with goals: Social media goals include brand awareness, lead generation, and website traffic. KPIs ensure your social media activities are directly tied to these goals. You can see if your efforts are moving the needle in the right direction by tracking relevant metrics.
How to set the right KPIs for social media
Choosing the right KPIs for your social media strategy isn’t about tracking everything possible—it’s about focusing on metrics that directly connect to your business goals. Here’s how to set KPIs that actually matter:
Start with your business objectives
Before diving into metrics, clearly define your social media goals. Are you building brand awareness, generating leads, driving website traffic, or increasing sales? Your goals determine which KPIs deserve your attention. For example, if your main goal is brand awareness, you’ll focus on reach and impression metrics. If you’re after sales, conversion rates and revenue generated from social traffic become your priority.
Make them SMART
Effective KPIs are Specific, Measurable, Achievable, Relevant, and Time-bound:
- Specific: Pinpoint exactly what you want to track
- Measurable: Use concrete numbers, not vague improvements
- Achievable: Set realistic targets based on your resources
- Relevant: Connect directly to business outcomes
- Time-bound: Set a clear timeframe for achievement
Instead of saying “increase engagement,” a SMART KPI would be “increase Instagram comment rate by 15% over the next quarter.”
Align KPIs with your funnel stages
Different KPIs matter at different stages of your marketing funnel:
- Awareness stage: Reach (total number of people who see your content), impressions (total number of times your content is displayed), follower growth rate
- Consideration stage: Engagement rates (likes, comments, shares relative to your audience size), click-through rates (percentage of people who click your links), website visits from social media
- Conversion stage: Lead generation numbers, conversion rates (percentage of visitors who complete desired actions), cost per acquisition (how much you spend to gain each customer)
Related: How to Optimize Marketing Funnel in 2025?
Establish baselines and benchmarks
Before setting targets, know your current performance (baselines) and research industry standards (benchmarks). For instance, if the average engagement rate in your industry is 2%, setting a goal of 4% is ambitious but potentially achievable, while targeting 20% might be unrealistic.
Remember that your KPIs should evolve as your business grows and your social media strategy matures. Quarterly metrics reviews ensure they align with your current business priorities.
Social media KPIs to measure reach
Reach is synonymous with brand awareness. If you post great content on your social media one day, nothing will happen by the next day or the day after. Because the message isn’t going to anybody without any effort.
This is where reach comes into the picture and takes your content to various individuals. To monitor your reach, you need to keep tabs on the following KPIs for social media.
1. Follower count & audience growth rate
Keeping an eye on the follower count is futile on its own. In conjunction with other KPIs, though, this number helps you understand how many people you touch base with. Getting this number isn’t rocket science. You only need to look at your social media dashboard or the profile.

Monitoring the audience growth rate, however, takes some effort. This growth rate gives you an idea of the speed at which your social media followers are growing.
So, it is not about how many followers you have but how quickly and how much they are growing compared to the past months. The formula for calculating your audience growth rate is straightforward.
Simply divide the number of new followers you gained on a social network for the month by your total audience. Then, multiply the number achieved by 100 to get a percentage of your audience growth.

You can always log these numbers into a social media KPI spreadsheet to see how well you perform on the followers’ front.
2. Impressions
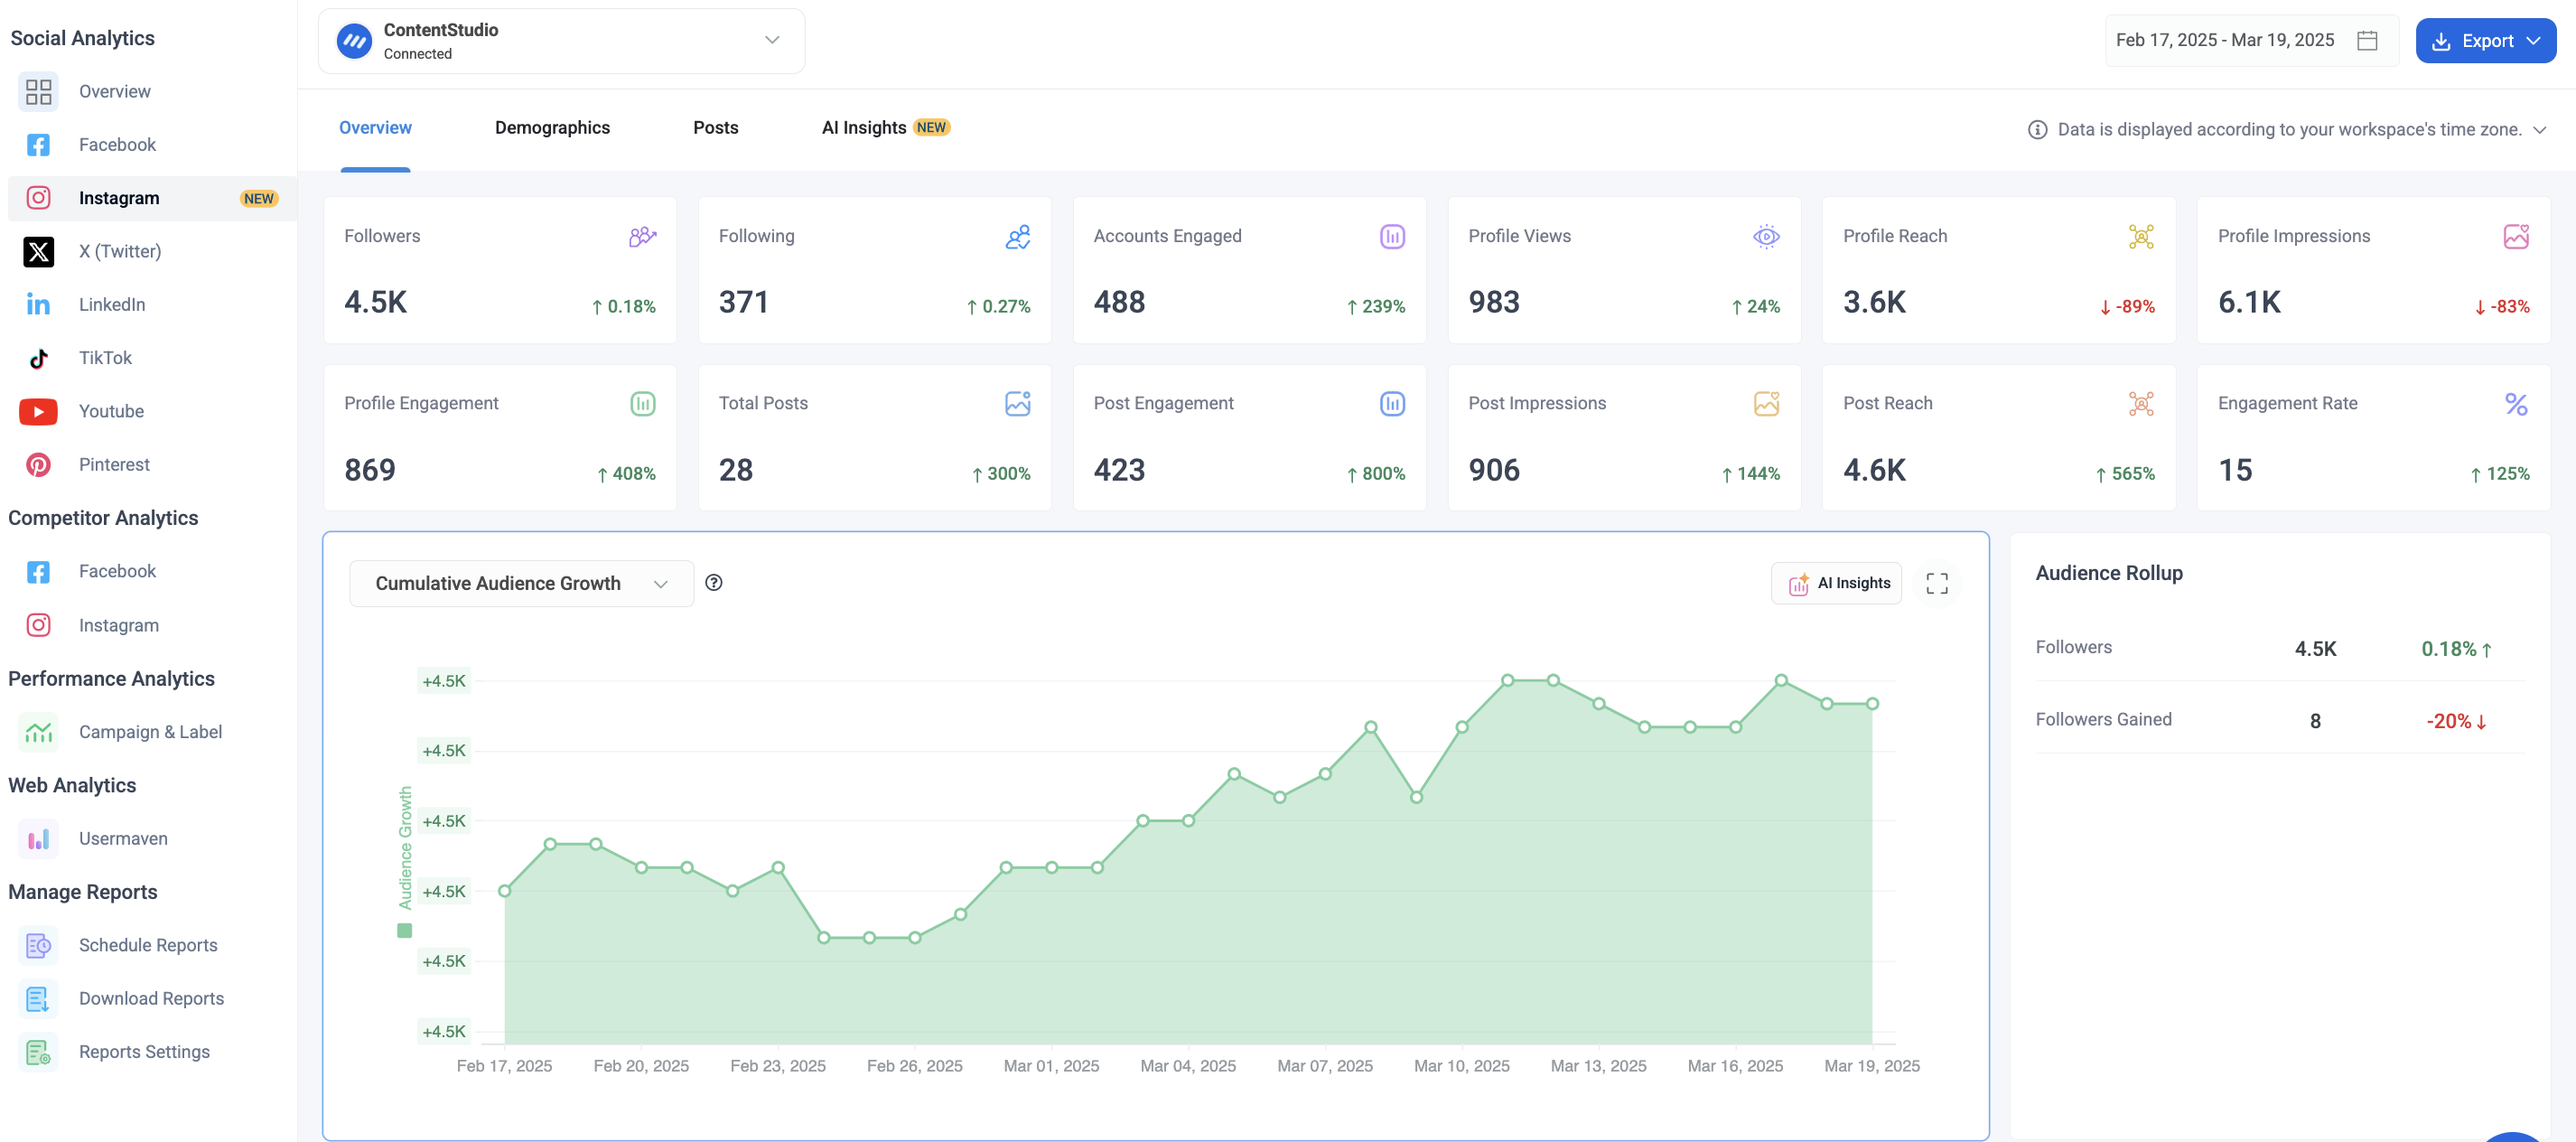
Impressions are the number of times that your post is/was viewed by your followers and beyond. The metric can be slightly vague, considering a single person can view your post multiple times. However, impressions still give you an idea of how far your post has reached.
Also Read: Instagram Impressions: What Are They & Why Do They Matter?
3. Post reach
Identifying your post reach helps you understand the basics of social media posting, timing, and content.
To calculate your post reach, take out the number of times a particular post has reached its audience from your post analytics. Next, divide this number by your total number of followers and multiply by 100. The number you get in the end is your post’s reach.
Identify this metric for various posts to see how well each is received. You can also log these into a social media KPIs spreadsheet for a clear idea of which types of posts have the greatest reach.
As you do this, you will note a pattern in the type of content that is well-received by your audience. You can also pinpoint the timings when your posts get a wider reach.
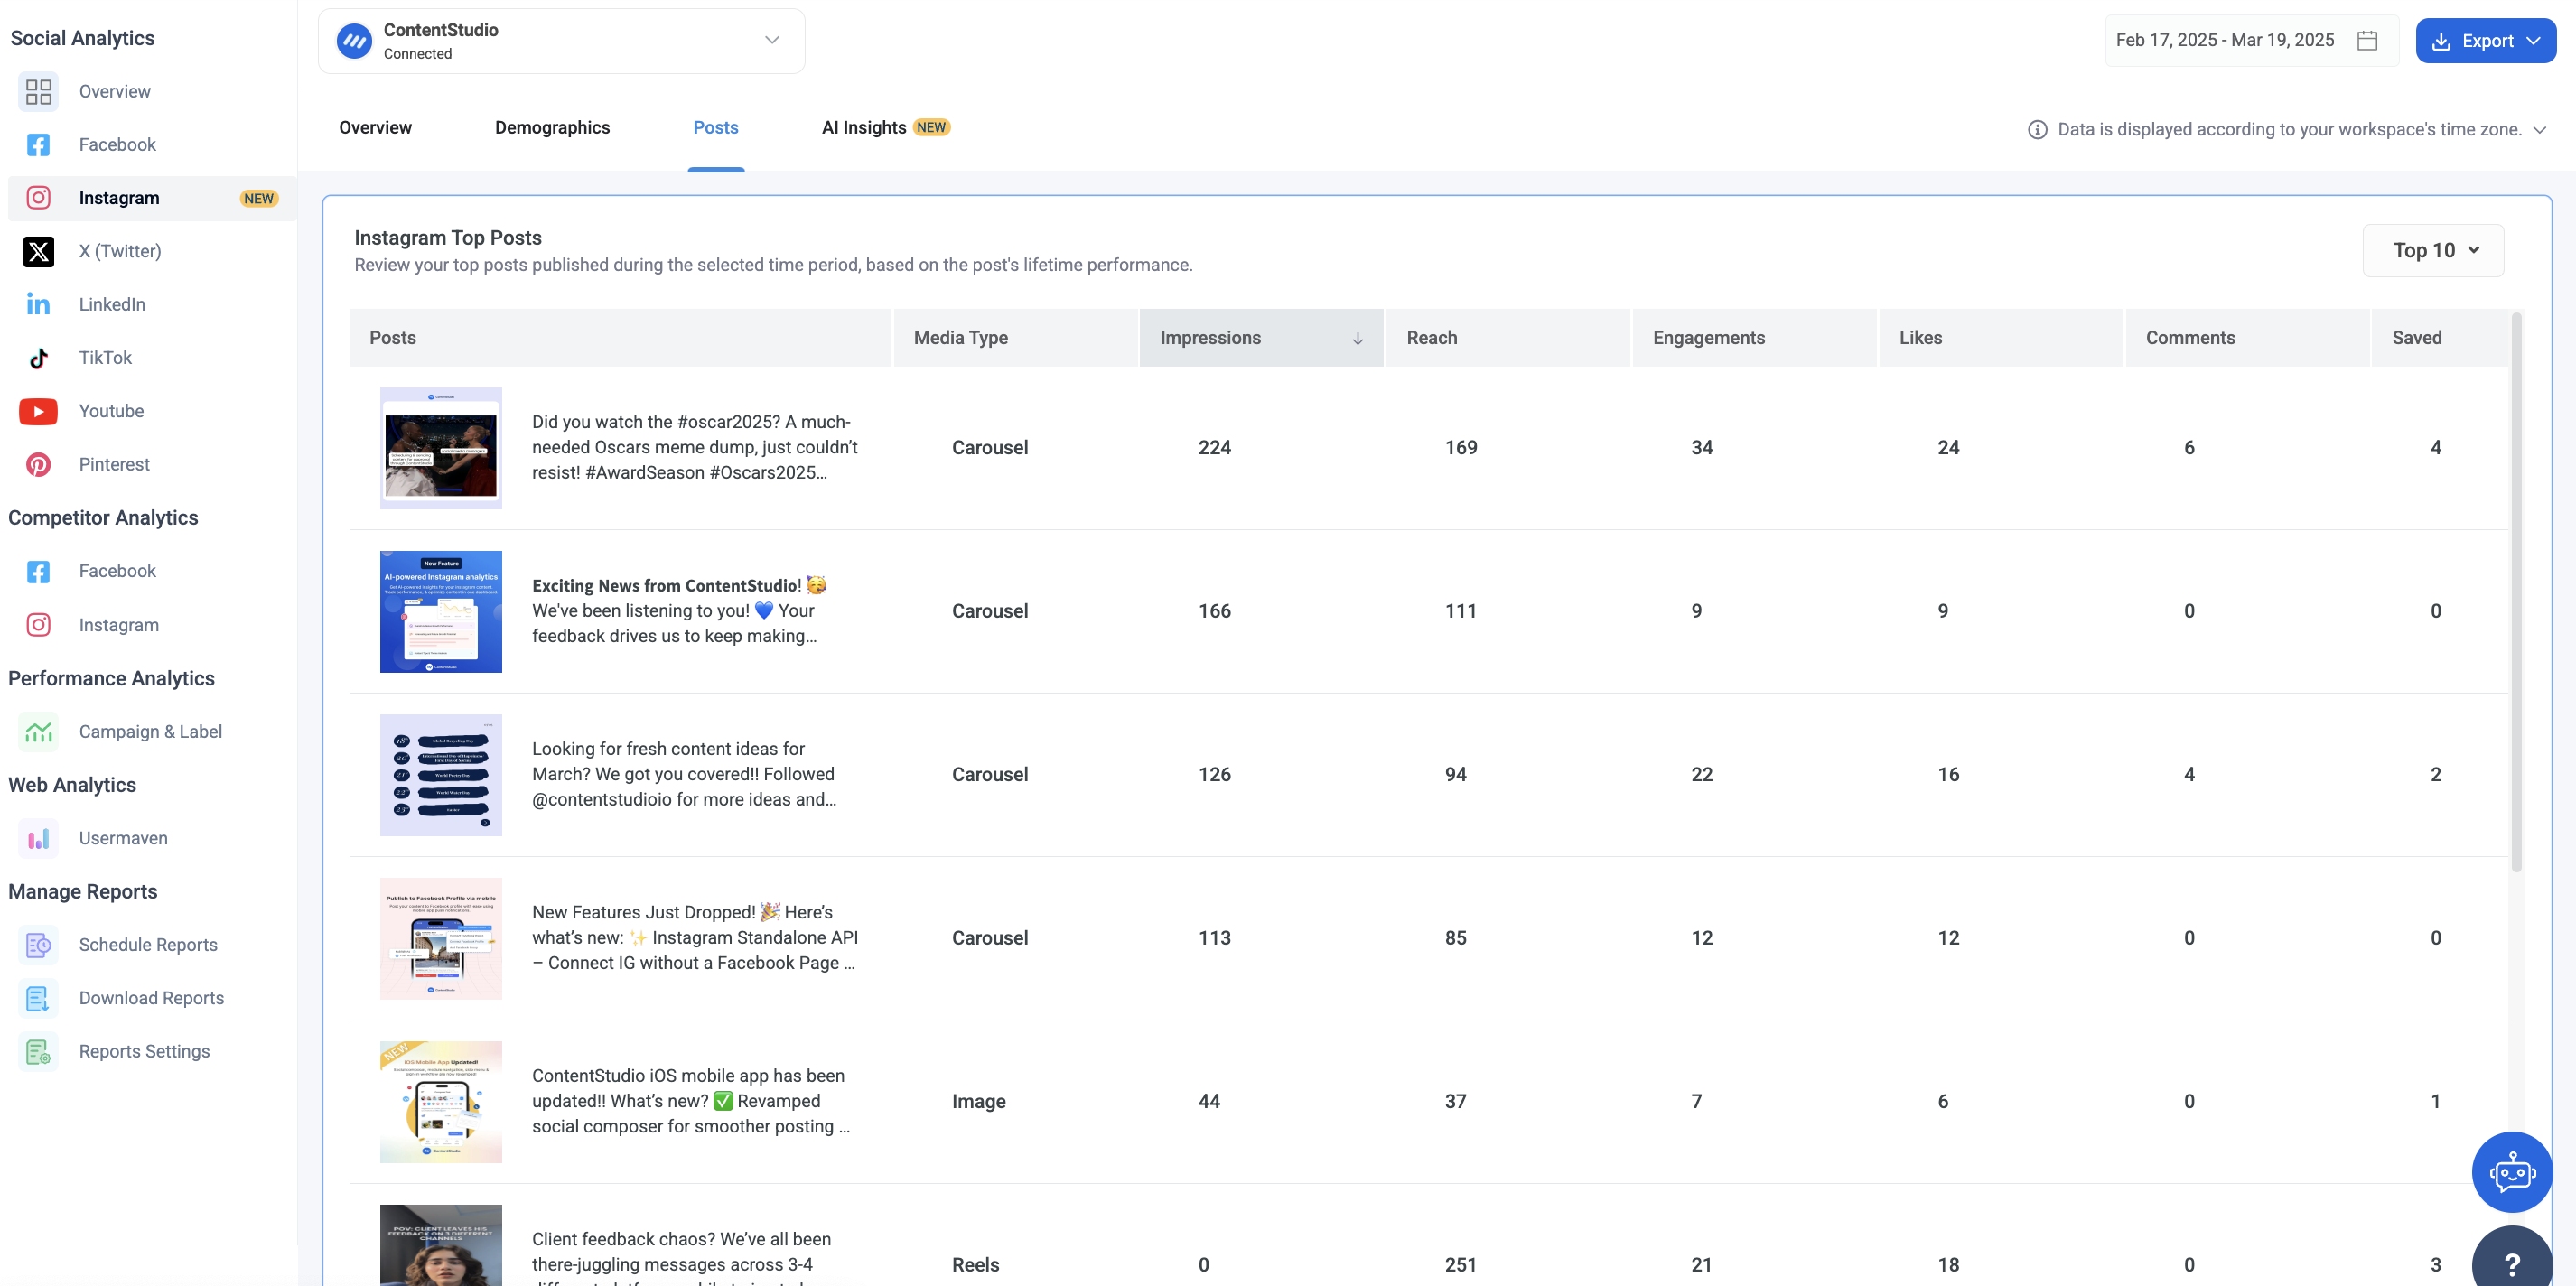
4. Social referral traffic
The traffic or number of people who head from social media to your website is the social referral traffic for your site. This is a crucial metric to follow because it signifies the interested leads you have nurtured.
It is also the first step in the process of converting your followers into customers. Use any analytics tool, such as Usermaven, to get a roundup of social media traffic to your site.
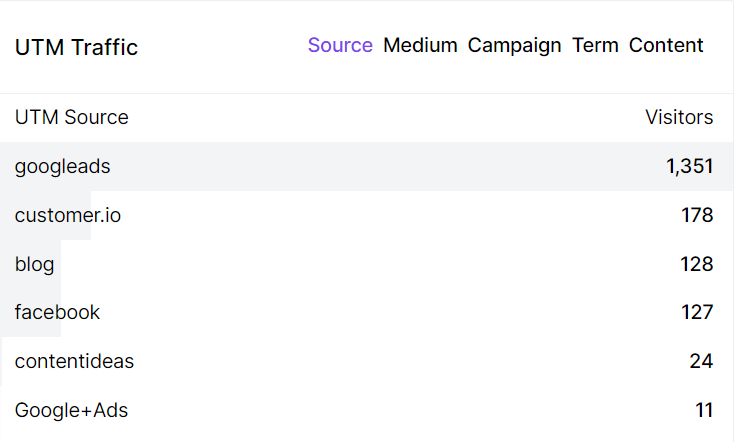
Two markers to watch over are:
Channels: Here, you can get a combined overview of the traffic from all your social media profiles over a given period.
Medium or Source: You will get a specific picture of segmented data here. This will display the particular social source of your traffic to see how much traffic you get from each social channel you use.
5. Video views
The term “video views” describes how often people have viewed your social media video content.
Different social media networks define what constitutes a view in different ways.
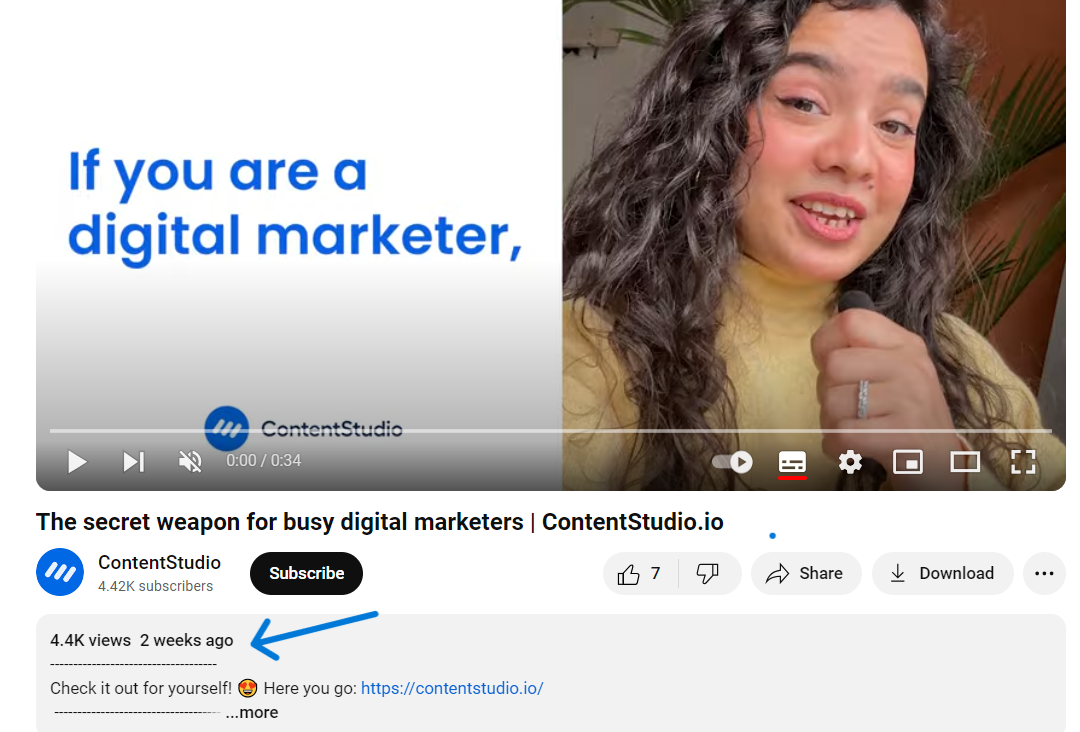
For example, a view is recorded on Facebook after a user views the video for three seconds or longer. It is counted on YouTube when a user begins playing a video.
Here is how TouTube shows video views:
Social media KPIs for engagement
Engagement is very precious. A mere presence on a social channel delivers nothing. If anything, it will only put off interested buyers, who will see your business as inactive. You’d be surprised to know that customers spend between 20% and 40% more with brands that engage and respond to them on social media.
Therefore, it wouldn’t be an overstatement if we say that engagement is the golden key to success on social media. Let’s now walk you through KPIs that can highlight how well you’re doing on this ground:
6. Reactions
Basic interaction takes the form of reactions. Usually, users have to click buttons that say things like “Like,” “Love,” “Celebrate,” or something similar.
Social media platforms might have different reactions available in different types and ranges.
Facebook, for example, provides various responses, such as “Love,” “Angry,” and “Sad.”

On the other hand, social media sites like Instagram prioritize “Likes.”
Users may easily interact with your material and express their feelings with these reactions.
Another interesting point is that the more likes you get, the higher your engagement will go. This is because social media algorithms favor posts that get more likes. Consequently, social engines show those posts more, which gets them more engaged.
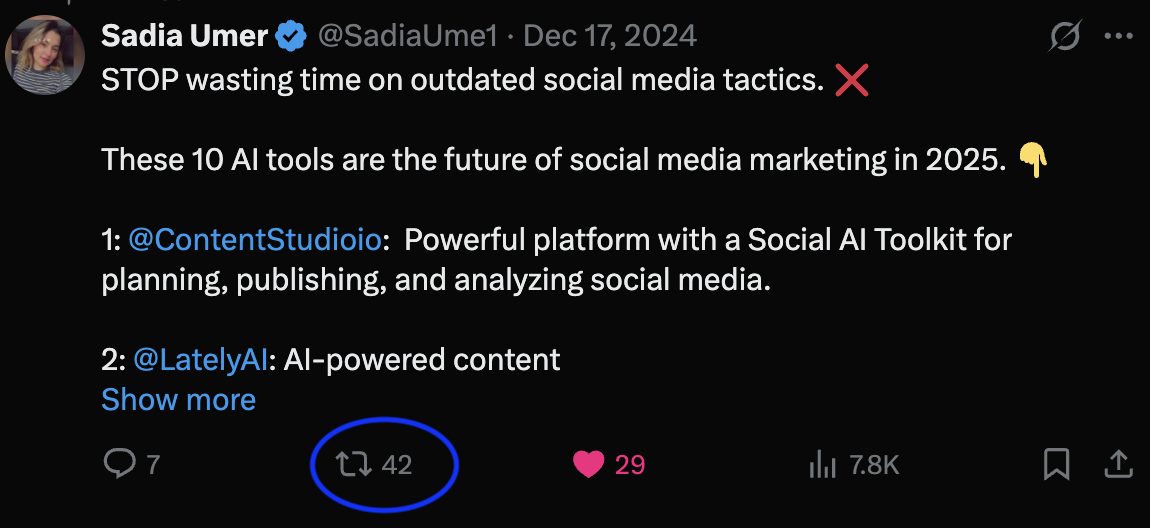
7. Shares
Many folks are likely to like everything that shows up on their newsfeed. The share metric, however, is a telltale sign of your follower’s interest, so he shared the post with his audience.
Furthermore, shares help you reach a wider audience. Therefore, ministering to these is also important.
8. Comments
Another important social media KPI that speaks volumes of your engagement is comments. While likes and shares are only a matter of a click, comments take time, which is why they’re so valuable.
When your followers comment on your post, it shows that they genuinely appreciate your social media content. Such customers are also more likely to convert.
Plus, comments also get you more engagement. When a user comments on your post, his action is typically viewed in his friends’ feeds, which can broaden your reach. In certain instances, comments are directly proportional to a wider reach. A case in point is LinkedIn, where likes don’t widen your reach and increase engagement, but comments do.
John Espirian, LinkedIn influencer and copywriter, emphasizes this. He explains, “Why does LinkedIn like comments so much? Perhaps because good conversations are the best foundations for building relationships – and that’s what doing business is all about.”
Also Read: How to Positively Handle Negative Comments on Social Media?
9. Clicks
Your click-through rate is always an all-important metric to monitor. A high click rate testifies that your call-to-action (CTA) is effective enough to encourage folks to take action. Moreover, followers willing to click a link to your site or blog will likely convert better too.
While link clicks are critical, you also need to pay attention to your site’s bounce rate. A high bounce rate signifies failing to capture your audience’s interest.
On the flip side, a high click rate paired with a lower bounce rate shows that your landing page is working its magic, helping you increase your sales. If your likes, shares, clicks, and comments are gloomy, consider using a tool like ContentStudio to consistently share social content.
10. Saves
Users who store your content for later viewing are known as saves. (This KPI on X is referred to as a “Bookmark.”)
Posts can be saved and unsaved by users at any time.
Users can also examine every post they’ve saved by going to a designated area on their profile.
Users can even create collections on certain sites (like Instagram) by organizing their saved posts into distinct categories, which assists them in classifying useful stuff they find.
The save button on an Instagram post looks like this:

11. Virality rate
Who doesn’t want to go viral for all the good reasons, right? This welcomes the virality rate into the social media KPIs list to measure. To begin with, you need to set up a reporting period and go on to pick a post.
Identify the impressions and number of shares it got for the specified duration. Now, divide the share by their impressions times 100. You’ll get your post’s virality rate in no time.
You can log this rate into your social media KPIs spreadsheet and see how well you are doing to achieve your virality goals over time.
Related Read: 16 simple ways to make your blog post go viral
12. Active followers
The active followers metric is a crucial KPI for growing your social media account and nurturing a targeted audience. An active follower is the one who has interacted with you in the last 30 days. It is important you keep an account of active and inactive followers so that you can reach and engage with interested leads.
Moreover, the odds of inactive followers increase as fake accounts and bots grow.
P.S. Do you ever wonder who viewed my Facebook profile recently?
13. Profile visits
The last metric for measuring your engagement is “profile visits”. This value gives you an idea of how well you are making splashes in the social media waters. You get your profile visits from your analytics dashboard on several social networks.
14. Review rating
Customer testimonials about your goods or services shared on social media sites are called social media reviews. Additionally, they typically have a rating attached.
Usually, review scores range from one to five.
Additionally, you can compute an average rating to measure client happiness holistically.
Add together all of the individual ratings to determine your average rating. Then, divide that amount by the total number of reviews.
Here is an example from Facebook that displays the reviews and ratings that a company has received:

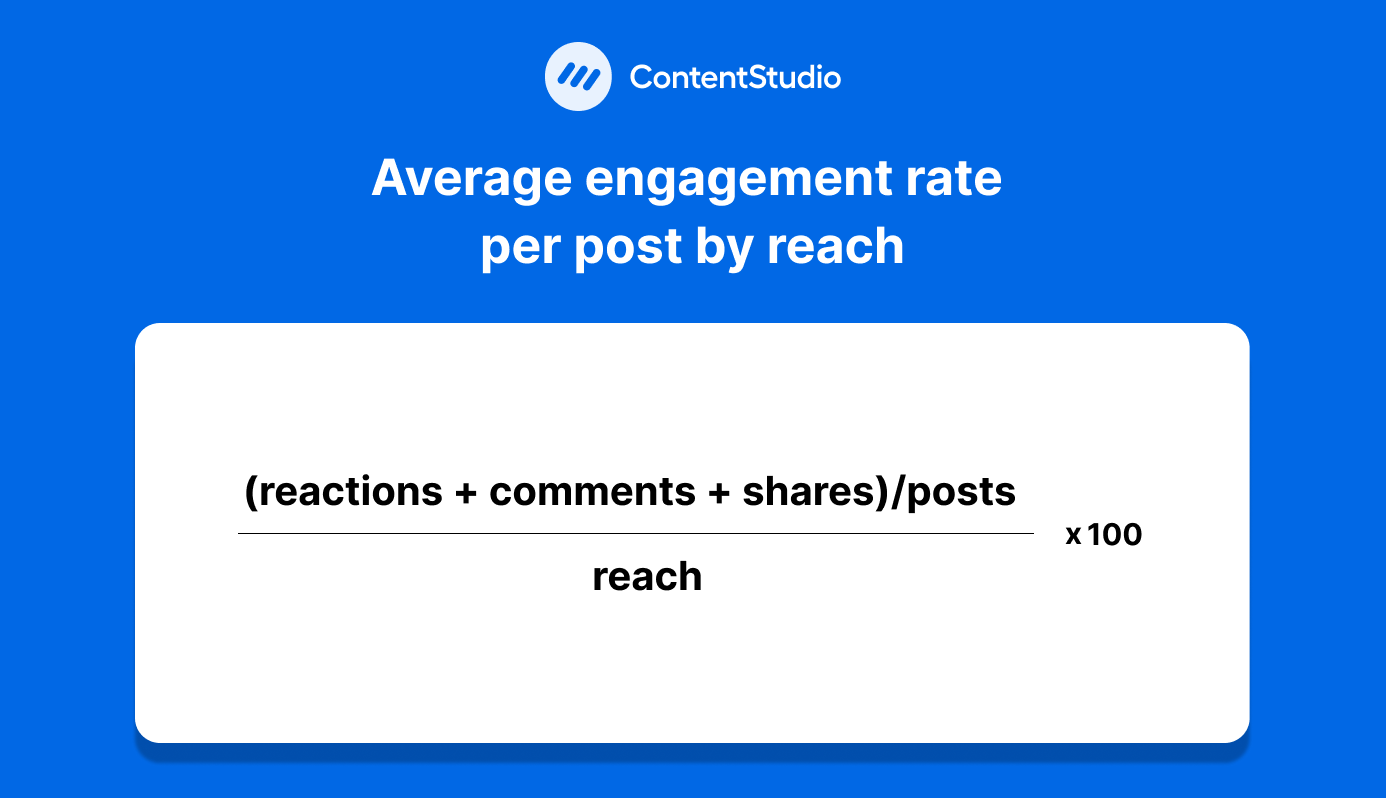
15. Average engagement rate
There are several ways to show your average engagement rate. However, it’s frequently the proportion of users who engage with your material in relation to your following.
You can find the average engagement rate by dividing the total number of engagements (likes, comments, shares, etc.) your posts received by the total number of posts made within a specific period.
Next, divide that outcome by your total number of followers. Then, multiply by 100 to obtain the rate.
This is how the formula appears:
KPIs for leads and conversion
As robotic as this may sound, leads are people who are interested in your product or service. In other words, these are prospects. When used effectively, social media can serve as a rich resource of warm leads ready to convert, provided you have significant reach and engagement.
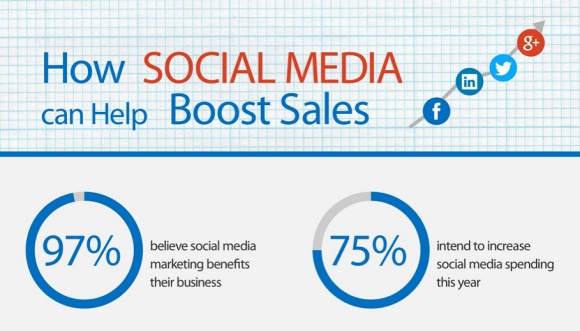
A page from Frank Body, an Australian-based beauty brand, shows that the business converted social leads so well that it ended up selling over 2 million body scrubs in 149 countries with an initial budget of $5000 only.
In this context, you need to track the following performance indicators:
16. Lead conversion rate
The number of leads you convert into customers denotes the lead conversion rate. These leads can be both direct and indirect. For instance, direct leads are those that buy your product or service via social nurturing, culminating in an increase in your revenue.
On the other hand, indirect lead conversions are not revenue-based but are actions that are a step toward a sale. Examples here include prospects downloading your free guide, subscribing to your newsletter, filling out an inquiry form on your website, and so on.
At the end of the day, it all comes down to your goals. Usermaven analytics are the best way to track your conversion rate.
You can measure the entire customer’s journey, helping you understand buying behavior. This will help you understand the true worth of each social media channel and amp up your conversion rate.
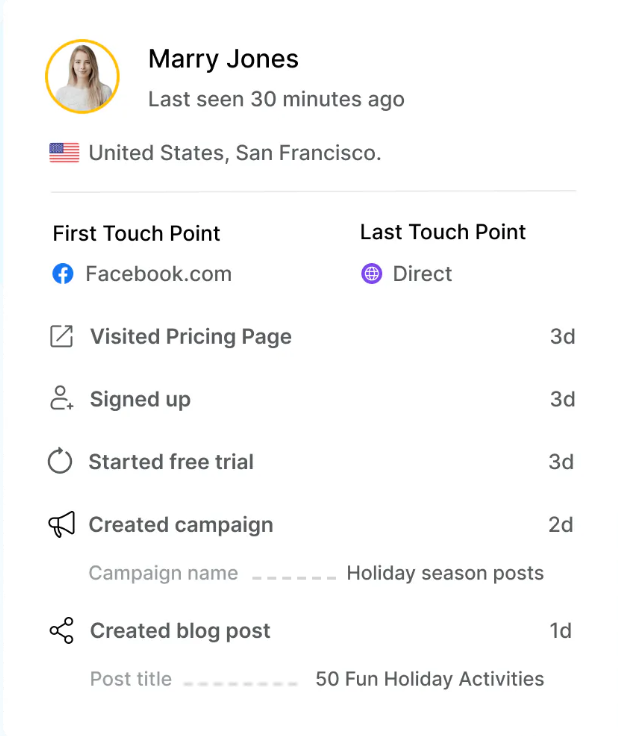
To get the exact conversion rate, divide the number of conversions by referrals times 100.
17. Click-through rate
This is another vital social media KPI to pursue. You already have an idea of how many clicks you are getting. However, the click-through rate indicator will give you the rate at which your posts convert. So start by collecting the clicks for a post containing your CTA.
For the same post, identify the impressions and then divide the clicks by impressions, multiplying by 100 in the end. This will give you a click-through rate. In case it is low, you’ll need to tweak your CTA.
Social media KPIs for customer support and loyalty
About 67% of consumers use social media to get answers to their queries. You would also be surprised to know that 1 in 3 social media users prefer social media customer care over email or telephone.
Of course, you can’t afford to lag in this department because a lack of response to customers’ queries can decrease customer advocacy by up to 50%. On the flip side, being responsive and exerting effort to improve your customer support can increase customer advocacy by approximately 25%.

Here are the social media KPIs that you need to measure to ensure that your customer support and relationship management game is on track:
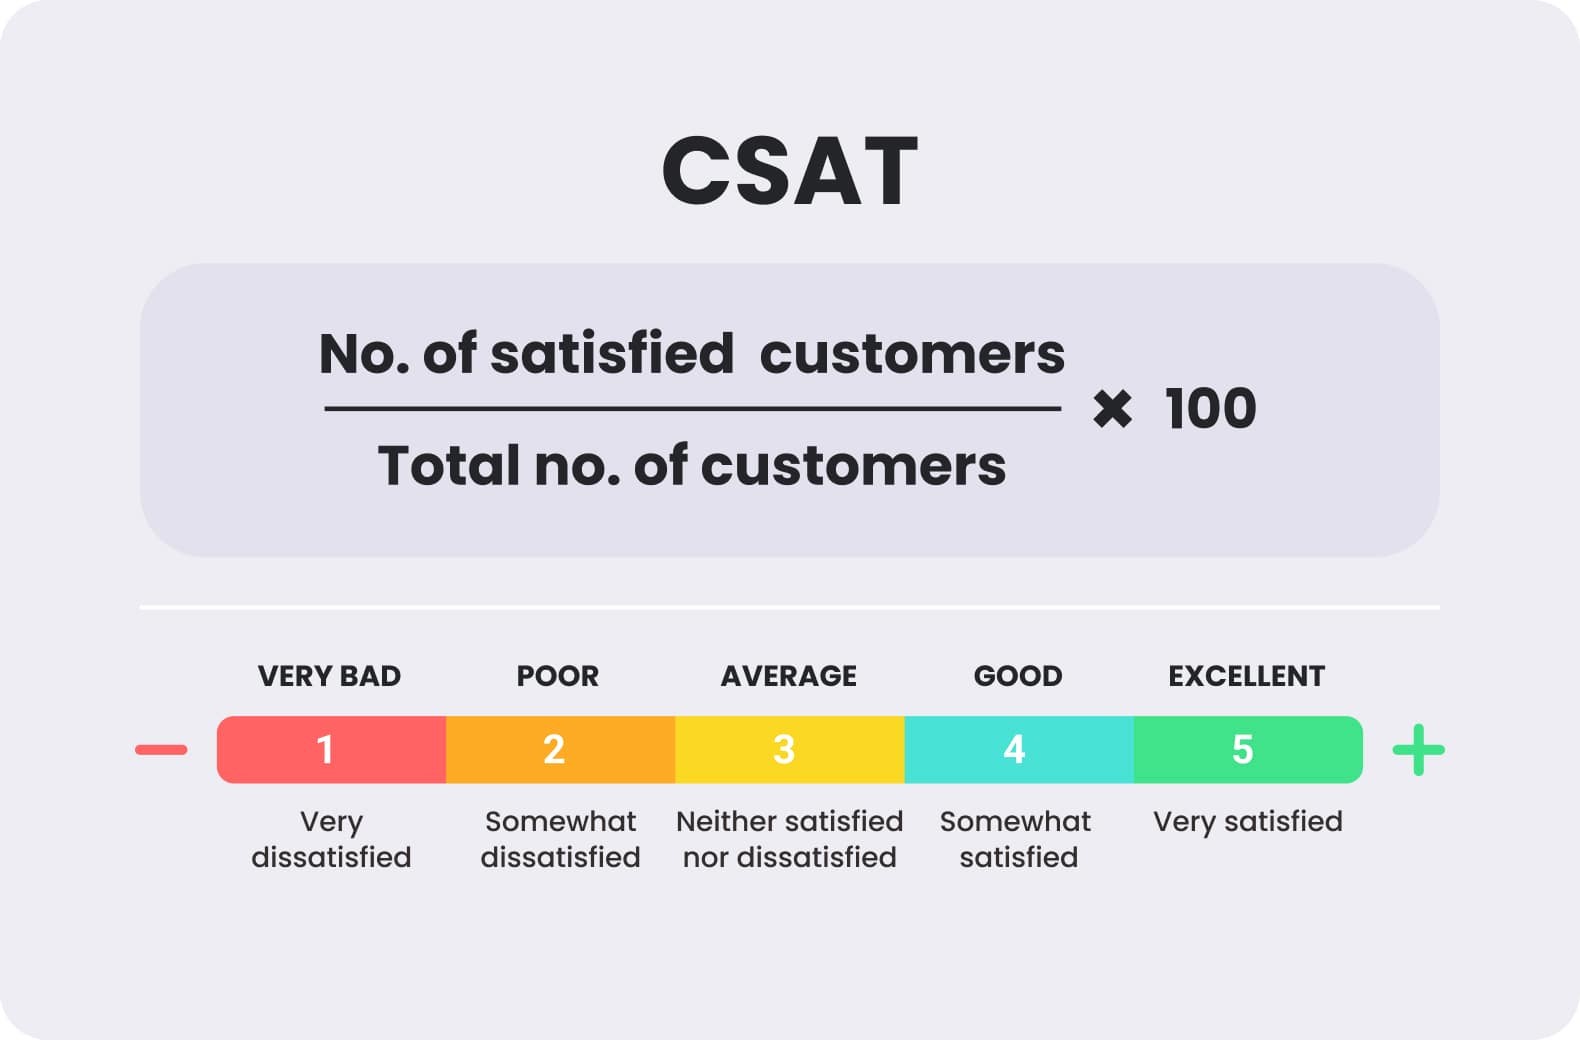
18. CSAT score
The customer satisfaction score shows how satisfied people are with your product or service. Simply ask your audience to rate their satisfaction on a scale of 1 to 10. Create a survey like Creative Boom magazine did to get feedback from its readers and start summarizing the responses.
Once done, take the total score and divide it by the number of respondents, and finally multiply it by 10. The figure achieved is your CSAT score. Repeat taking such surveys often to prepare a sketch of how satisfied your customers are with you over time.
19. Net promoter score
You can repeat the same process as above to understand how likely your customers are to recommend your products or services to others. This KPI is known as the net promoter score.
To begin with, ask your audience to rate their recommendations on a scale of 1 to 10 while creating a survey to record the answers. Separate and subtract the promoters’ number from detractors and divide by the total respondents. Multiply the figure achieved by 10 to get your net promoter score.
20. Share of voice + brand mentions
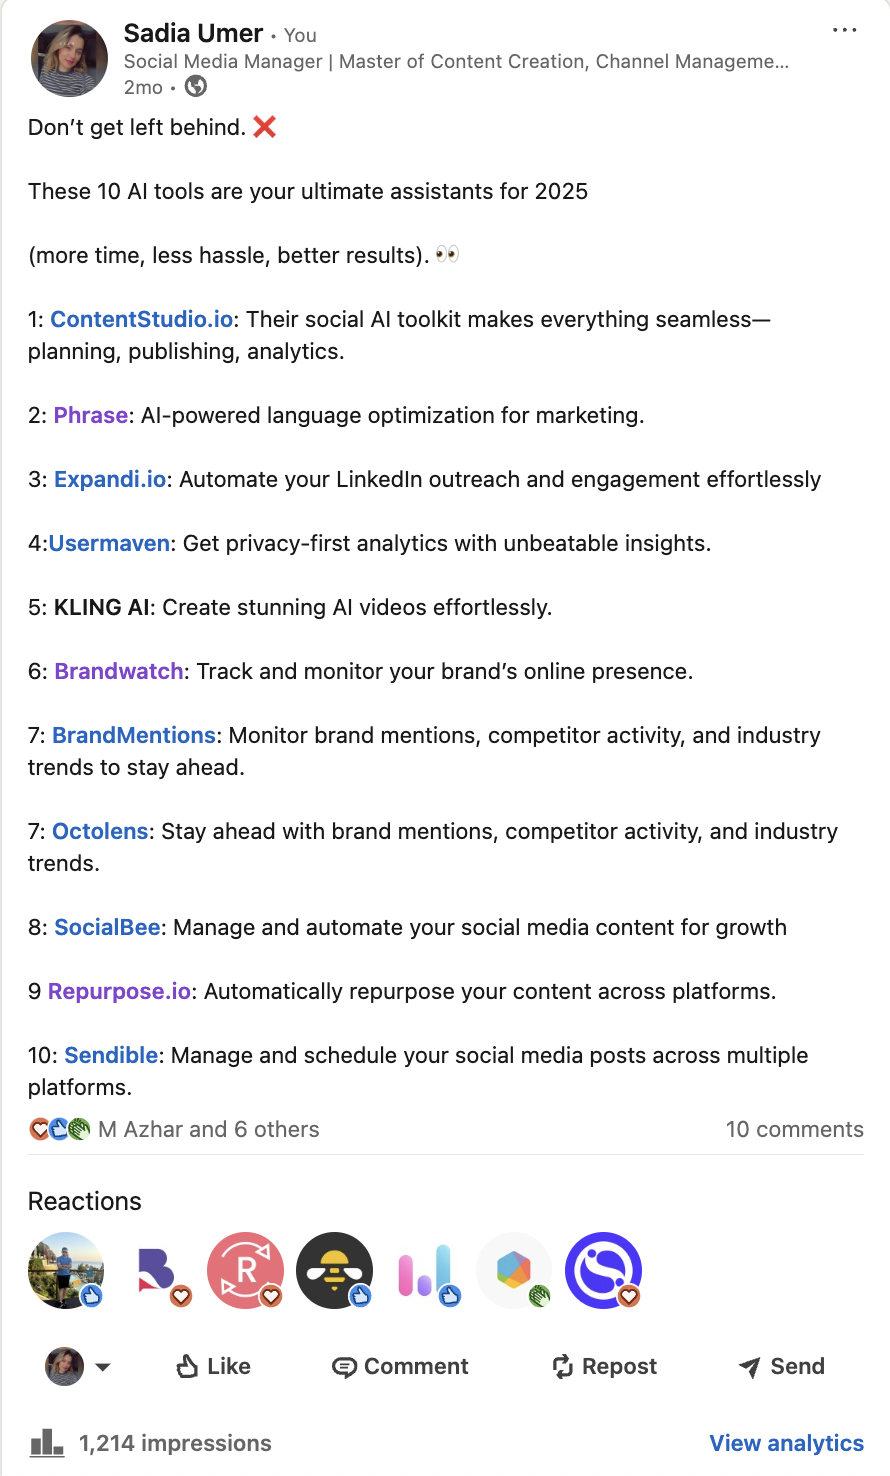
Your audience calling you directly (@contentstudio) or indirectly (Contentstudio) is called brand mentions. About 96% of the people who talk about companies on social media don’t even follow the business’s profile. Therefore, tracking mentions is fundamental for observing the social ripples your brand is making.
At the same time, you need to compare the impact that you are making in contrast with your competitors’ influence. This brings us to your social share of voice (SSOV). To this end, count each mention your business receives in a specified time and do the same for your competitors’ mentions.
Then, add the two figures to get the total mentions. Select your mentions and divide them by the total mentions. Multiply this number by 100 to get your SSOV rate. By removing your competitors’ rates, you can sketch the winner.
P.S. Use the free Instagram competitor analytics tool!
Tracking social media KPIs with ContentStudio
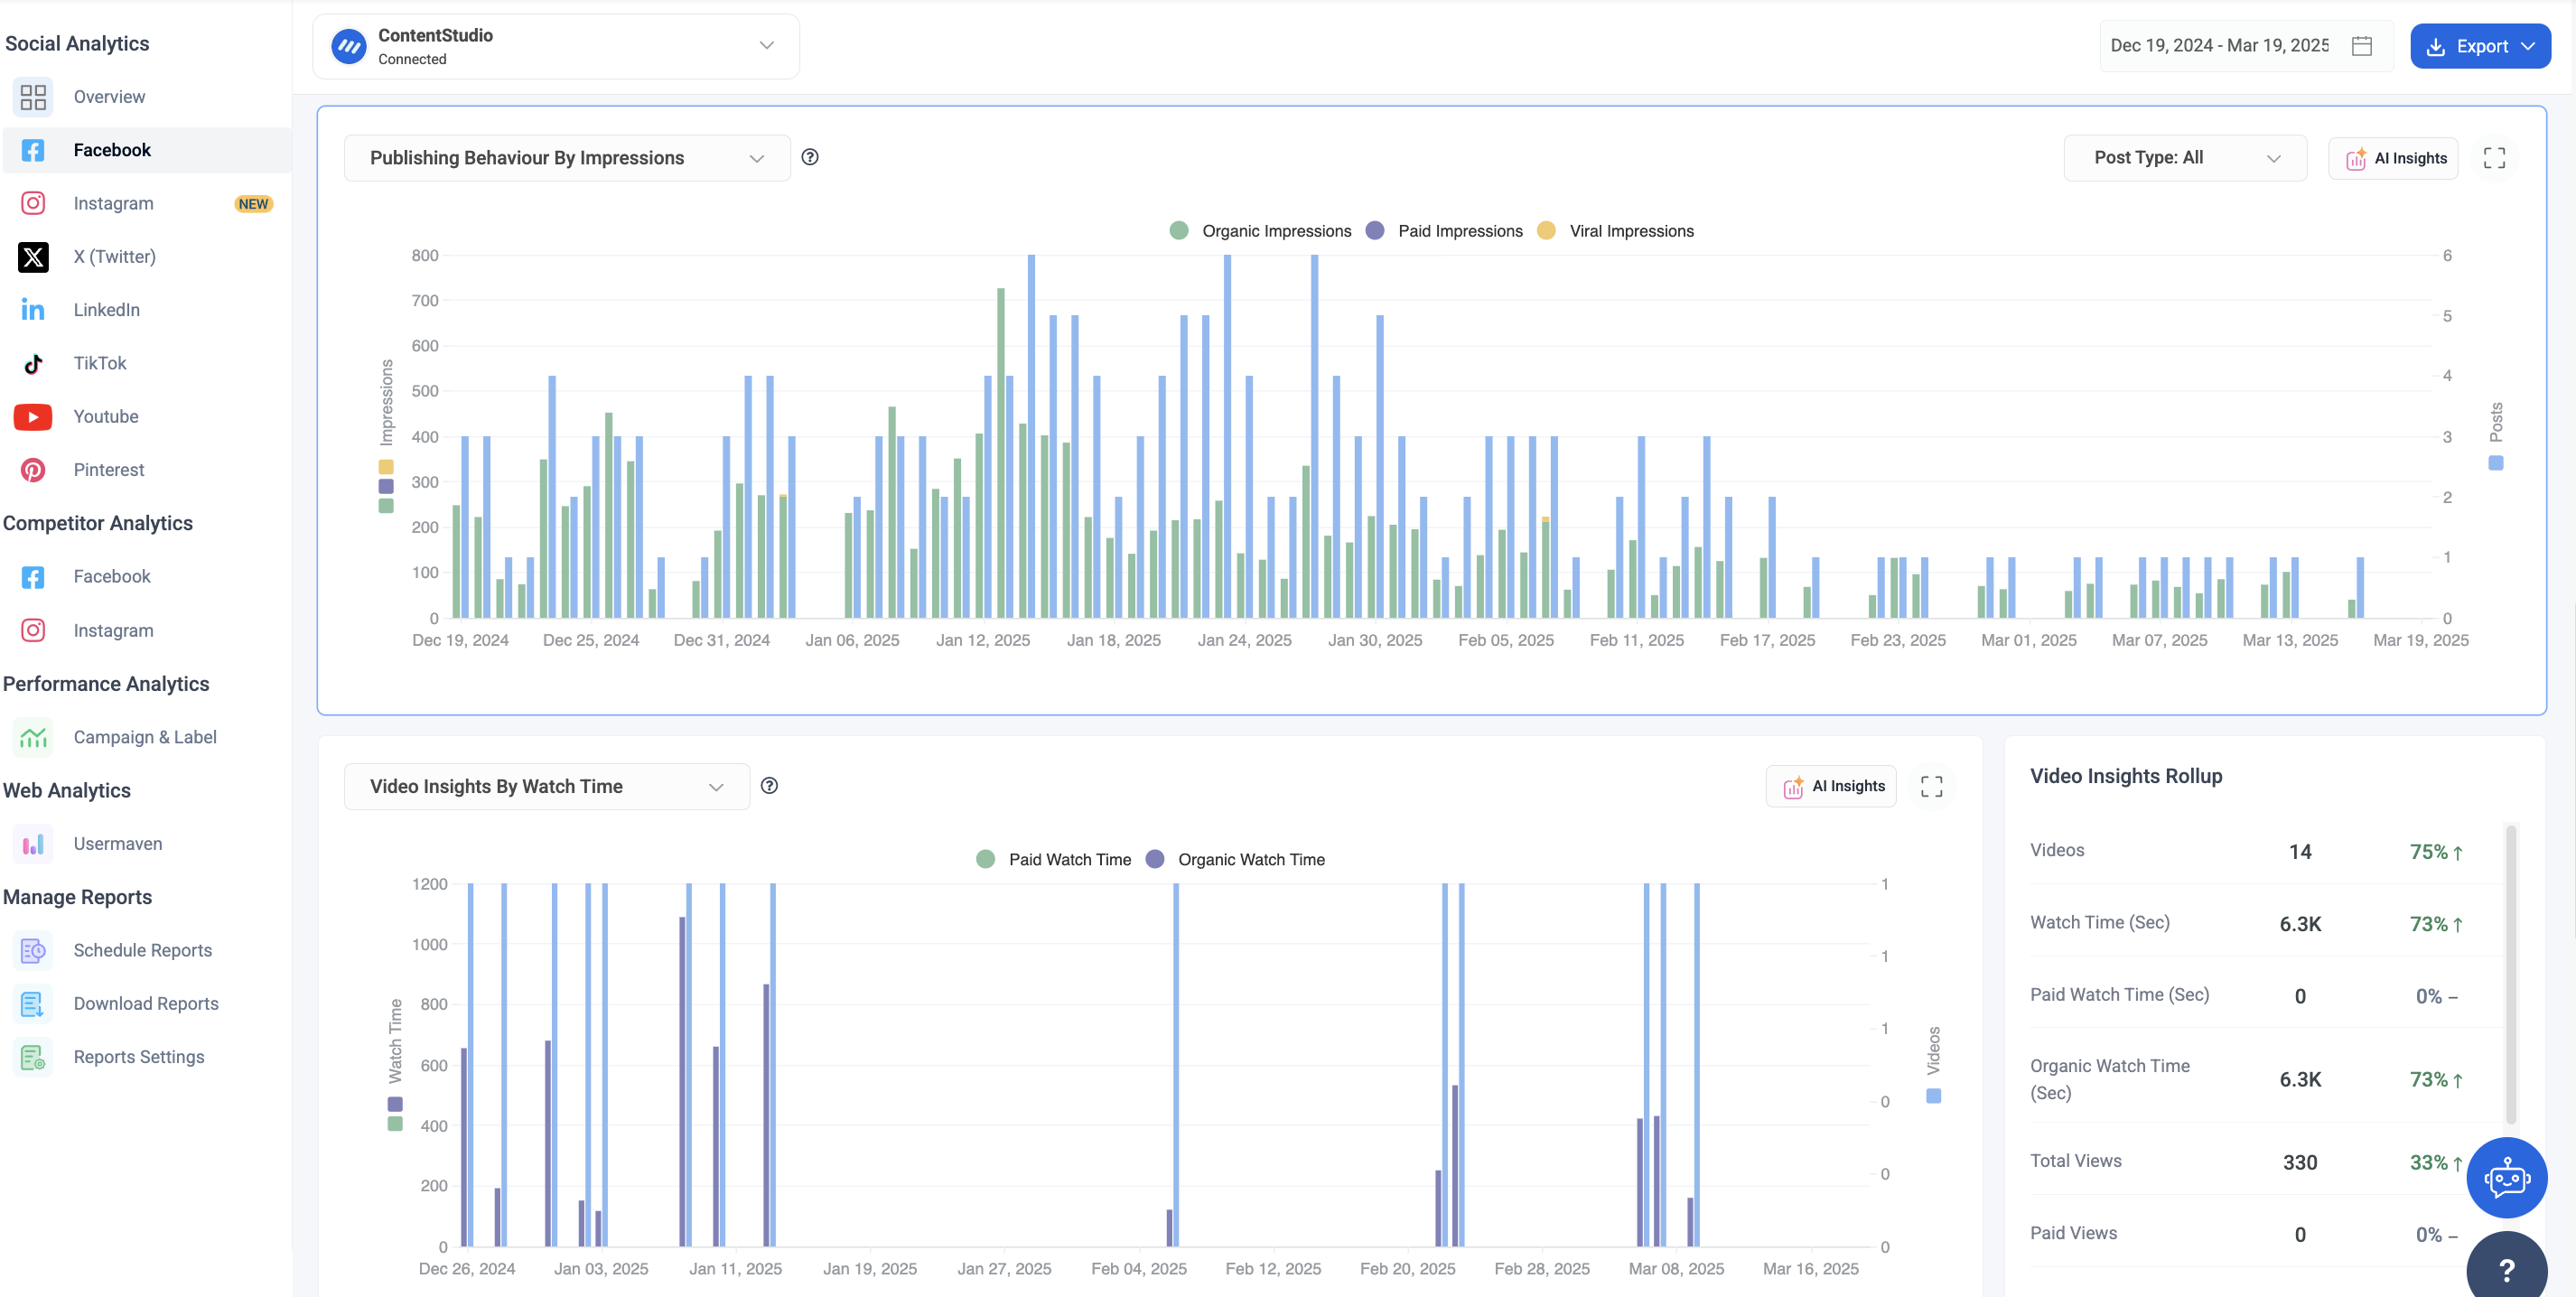
ContentStudio makes tracking your social media KPIs simple and efficient. The platform creates, analyzes, and organizes your social channels’ performance data into easy-to-understand reports that highlight what matters most.
ContentStudio’s analytics reports are fully customizable to showcase the data you need. Whether you want to track metrics for a single account or compare performance across all your social platforms, ContentStudio is your personal social media KPI dashboard.
The user-friendly interface eliminates manual data entry. ContentStudio automatically pulls in your metrics, and you can simply drag and drop elements to create reports tailored to your specific needs.
AI Insights: Intelligent analysis for better results
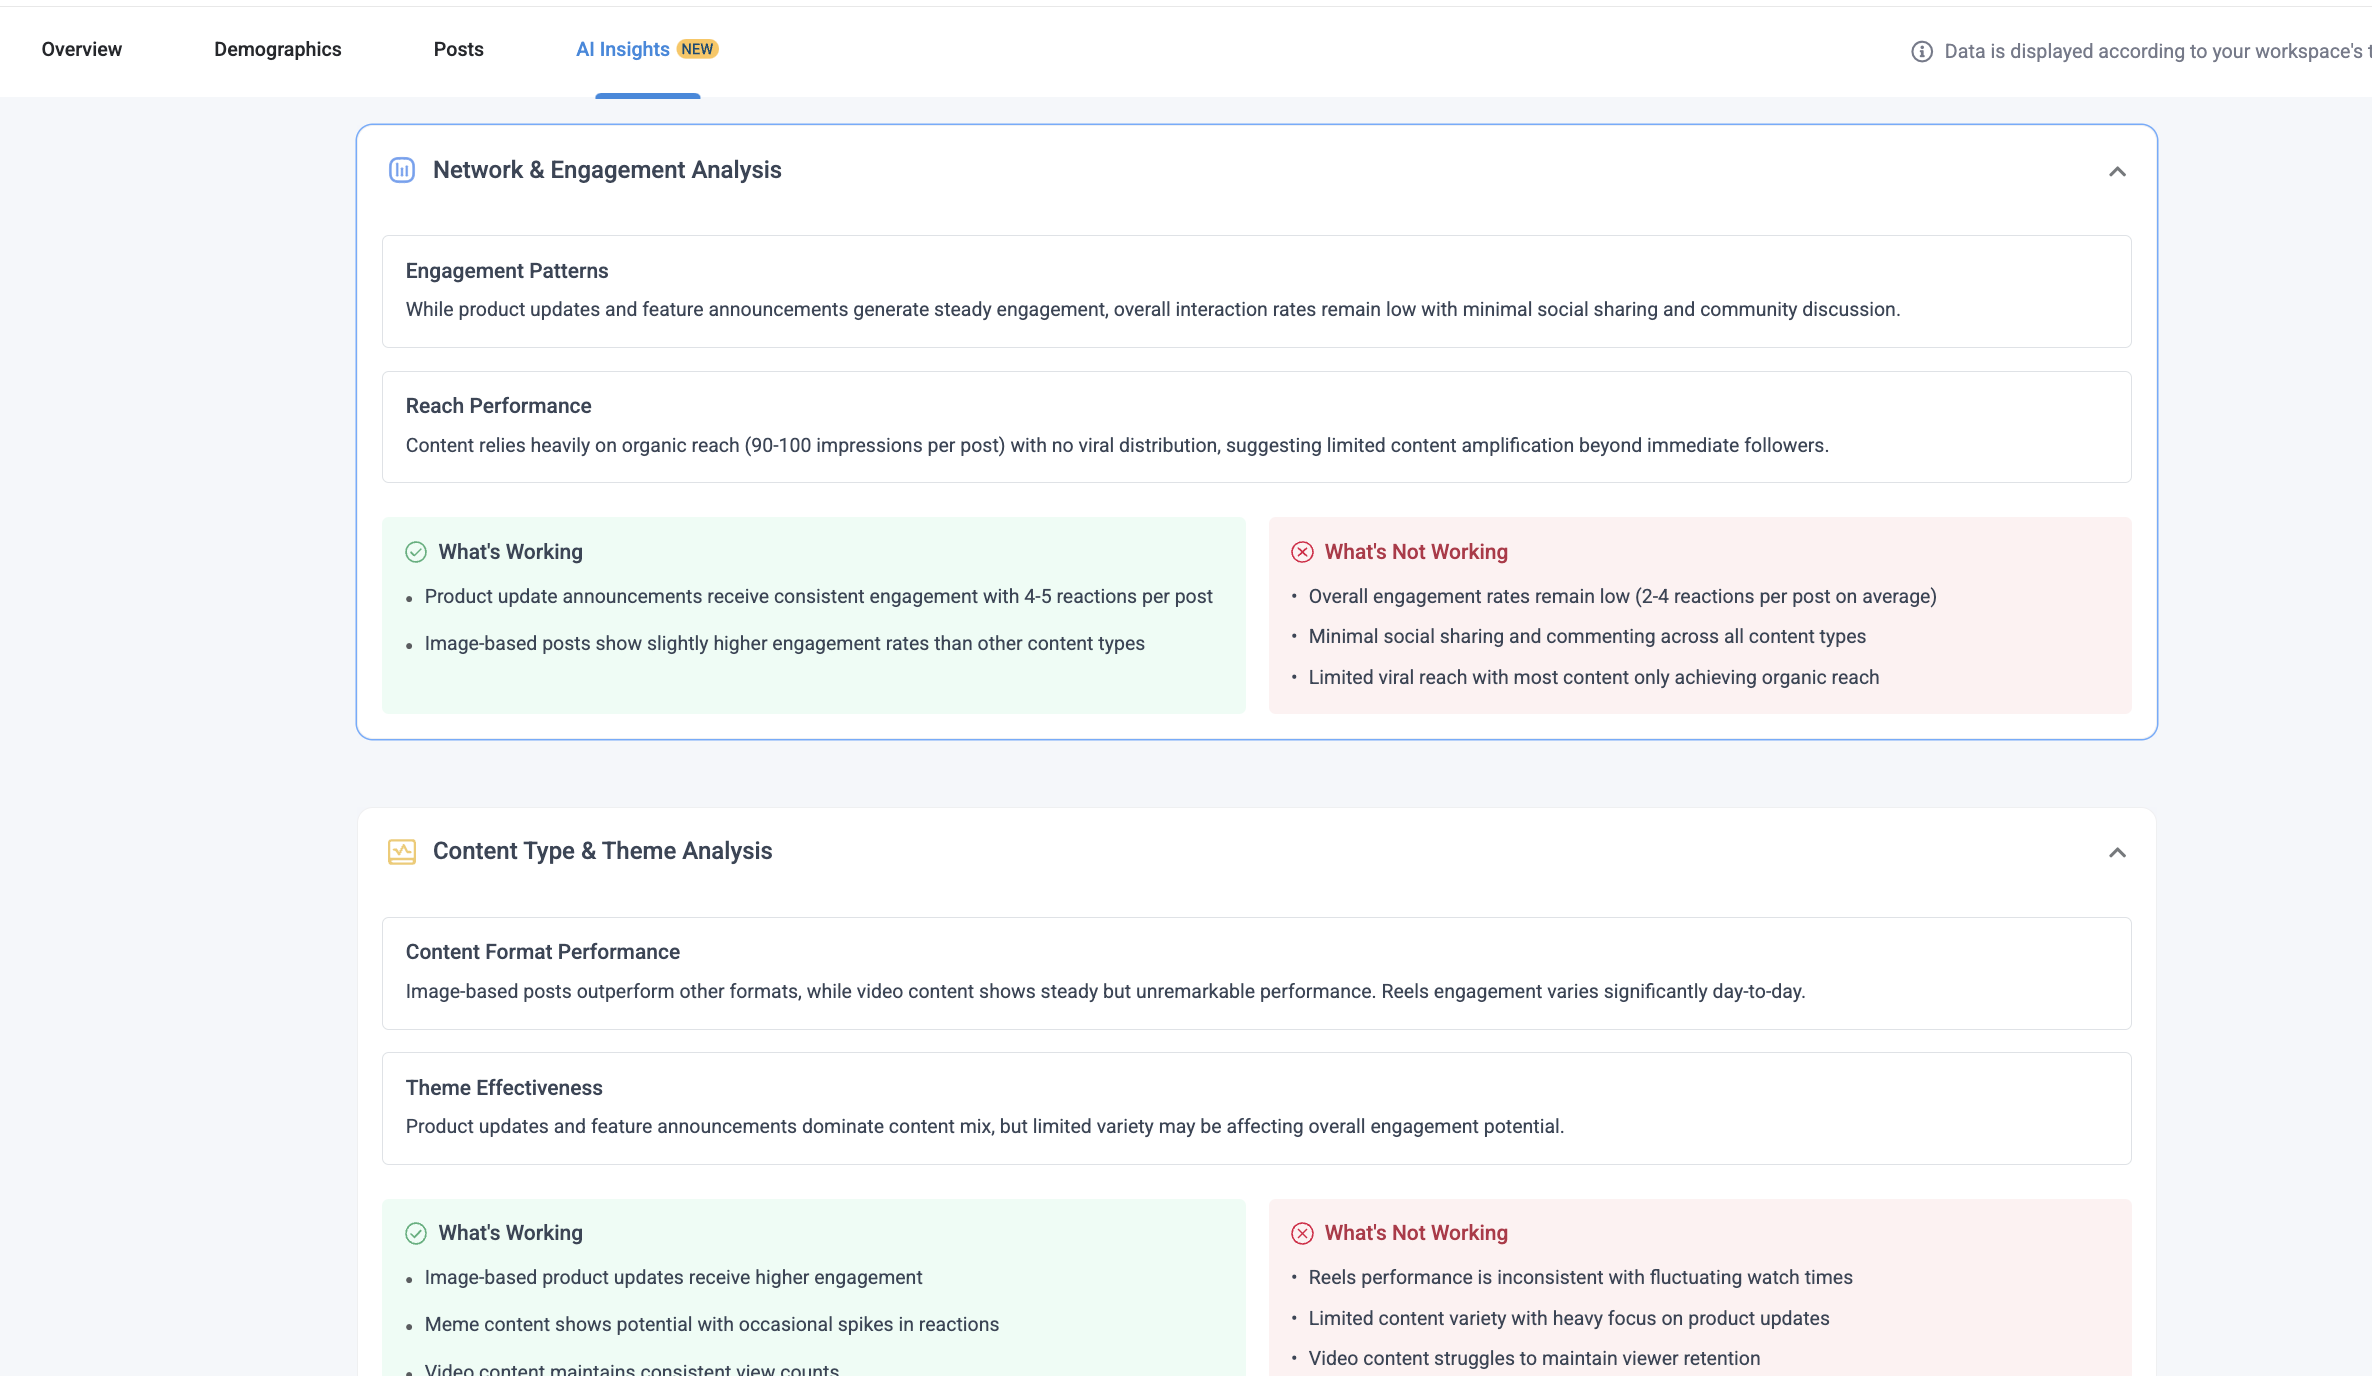
ContentStudio’s new AI Insights feature completely enhances your social media analytics experience. This powerful tool doesn’t just show you numbers—it interprets your data to reveal meaningful patterns and actionable recommendations.
The AI Insights dashboard provides:
- Engagement Pattern Analysis: Learn which types of content generate consistent engagement and where interaction rates need improvement
- What’s Working/What’s Not: Clear breakdowns of your highest and lowest-performing content with specific metrics
- Content Type & Theme Analysis: Discover which formats (images, videos, text) and topics resonate most with your audience
- Performance Forecasting: Predictive analytics that helps you anticipate future trends based on historical data
This AI-powered feature automatically identifies content strengths and weaknesses, saving you hours of manual analysis. For example, it might reveal that “image-based product updates receive higher engagement” or “video content struggles to maintain viewer retention,” giving you clear direction for content strategy adjustments.
Final thoughts
Since every business and social media strategy has distinct goals, it’s hard to single out one KPI as the most crucial. Having said that, engagement KPIs will likely be the most crucial statistic in 2024 for gauging the effectiveness and popularity of your content among followers.
Social media is an excellent channel for building customer relationships and improving revenue generation. Tracking these social media KPIs will clearly show how well your efforts align with your social media goals.
FAQ’s
What are the KPIs in social media?
Social media KPIs are metrics that measure your social media performance. Key KPIs include:
- Reach: Followers, impressions
- Engagement: Likes, comments, shares
- Conversion: Click-through rate, leads generated
- ROI: Revenue, cost per acquisition
- Content: Top performers by format/topic
- Brand: Mentions, sentiment
How do you measure social media performance?
To effectively measure social media performance:
- Define specific objectives (awareness, engagement, traffic, conversions)
- Track relevant metrics for each goal (reach, engagement rate, clicks, conversions)
- Use analytics tools from platforms or third-party solutions
- Analyze content performance to identify what works best
- Compare against benchmarks and competitors
- Create regular reports to track progress over time
What is the most important KPI in social media?
- Follower count & audience growth rate
- Impressions
- Post reach
- Social referral traffic
- Video views
- Reaction
- Shares
- Comments
- Saves
- Clicks
- Virality rate
- Active followers
- Profile visits
- Average engagement rate
- Lead conversion rate
- Click-through rate
- Cost per click
- Sales revenue
- CSat score
- Net promoter score
- Review rating
- Share of voice + brand mentions
Recommended for you


Powerful social media management software
14-day free trial - No credit card required.
