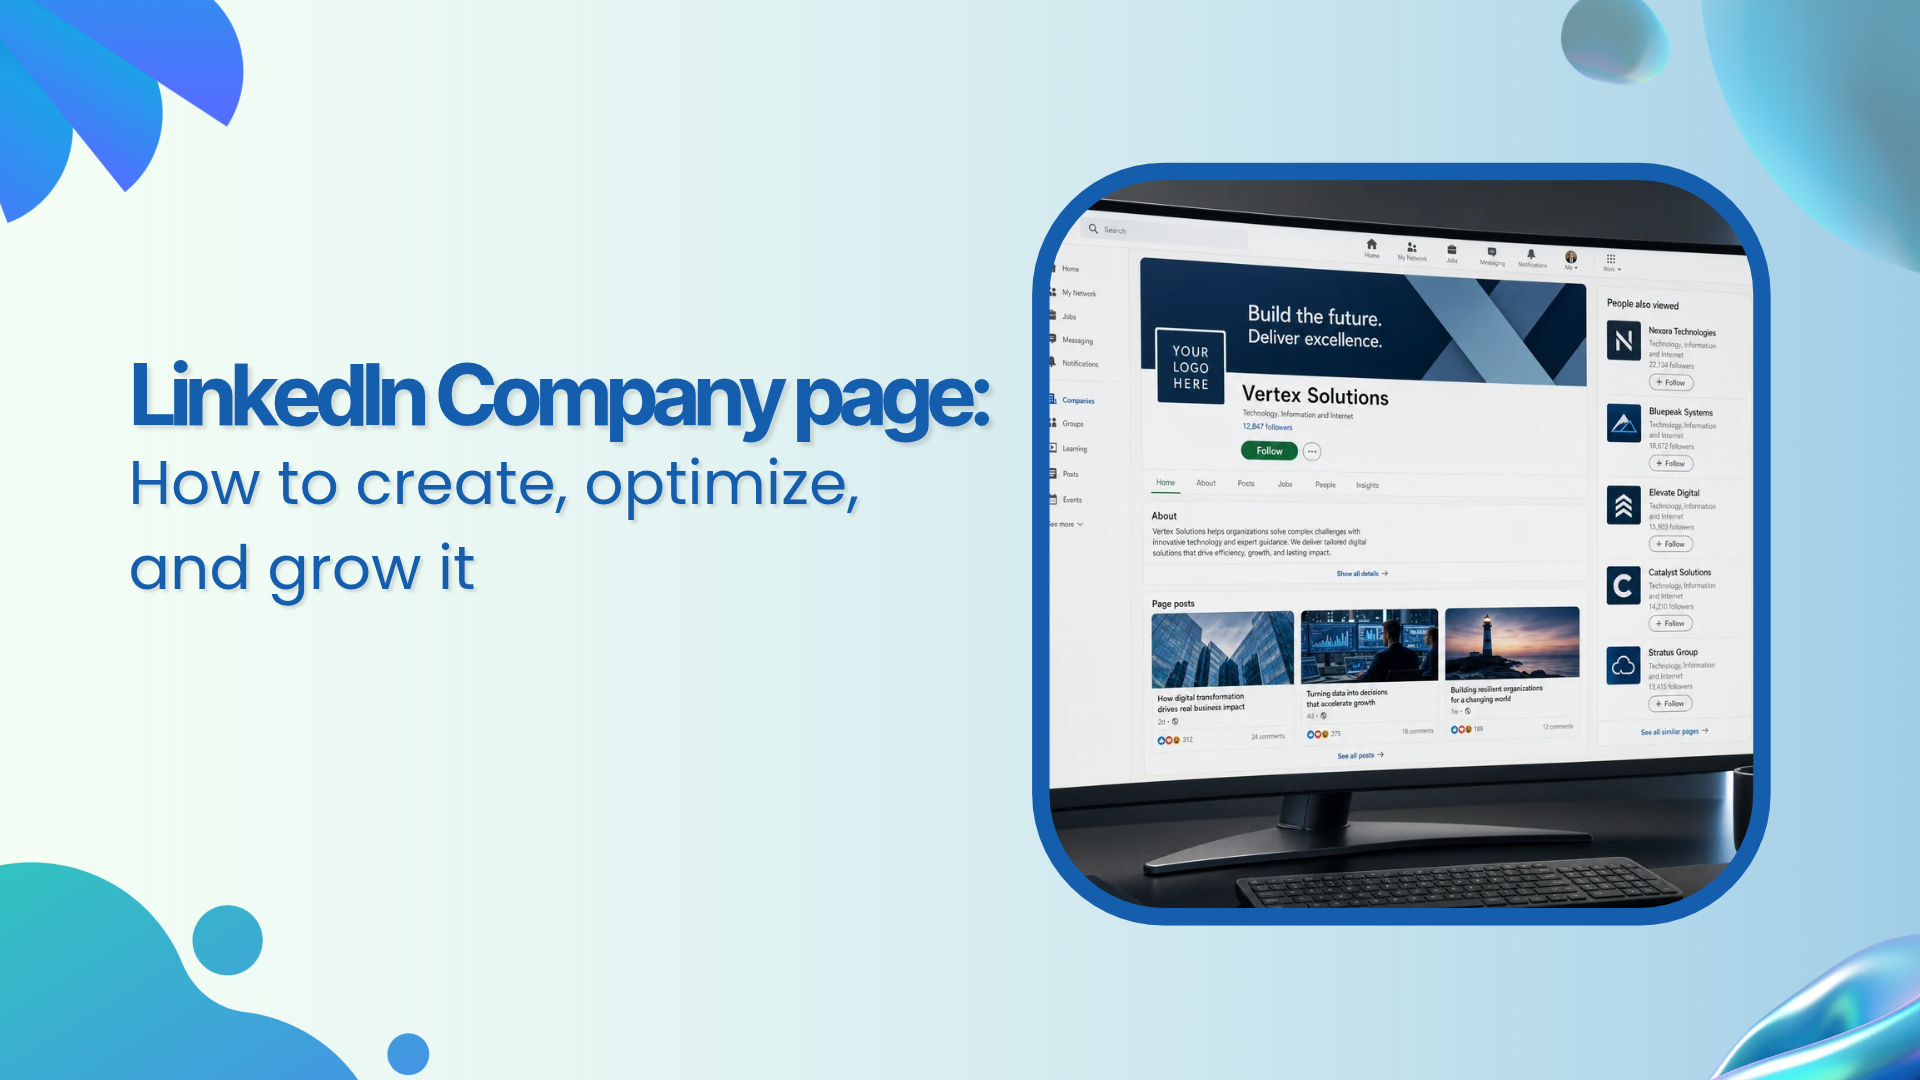
LinkedIn Company page guide: How to create, optimize, and grow it
Sep 24, 202621 minutes

Written by
Arooj IshtiaqUpdated
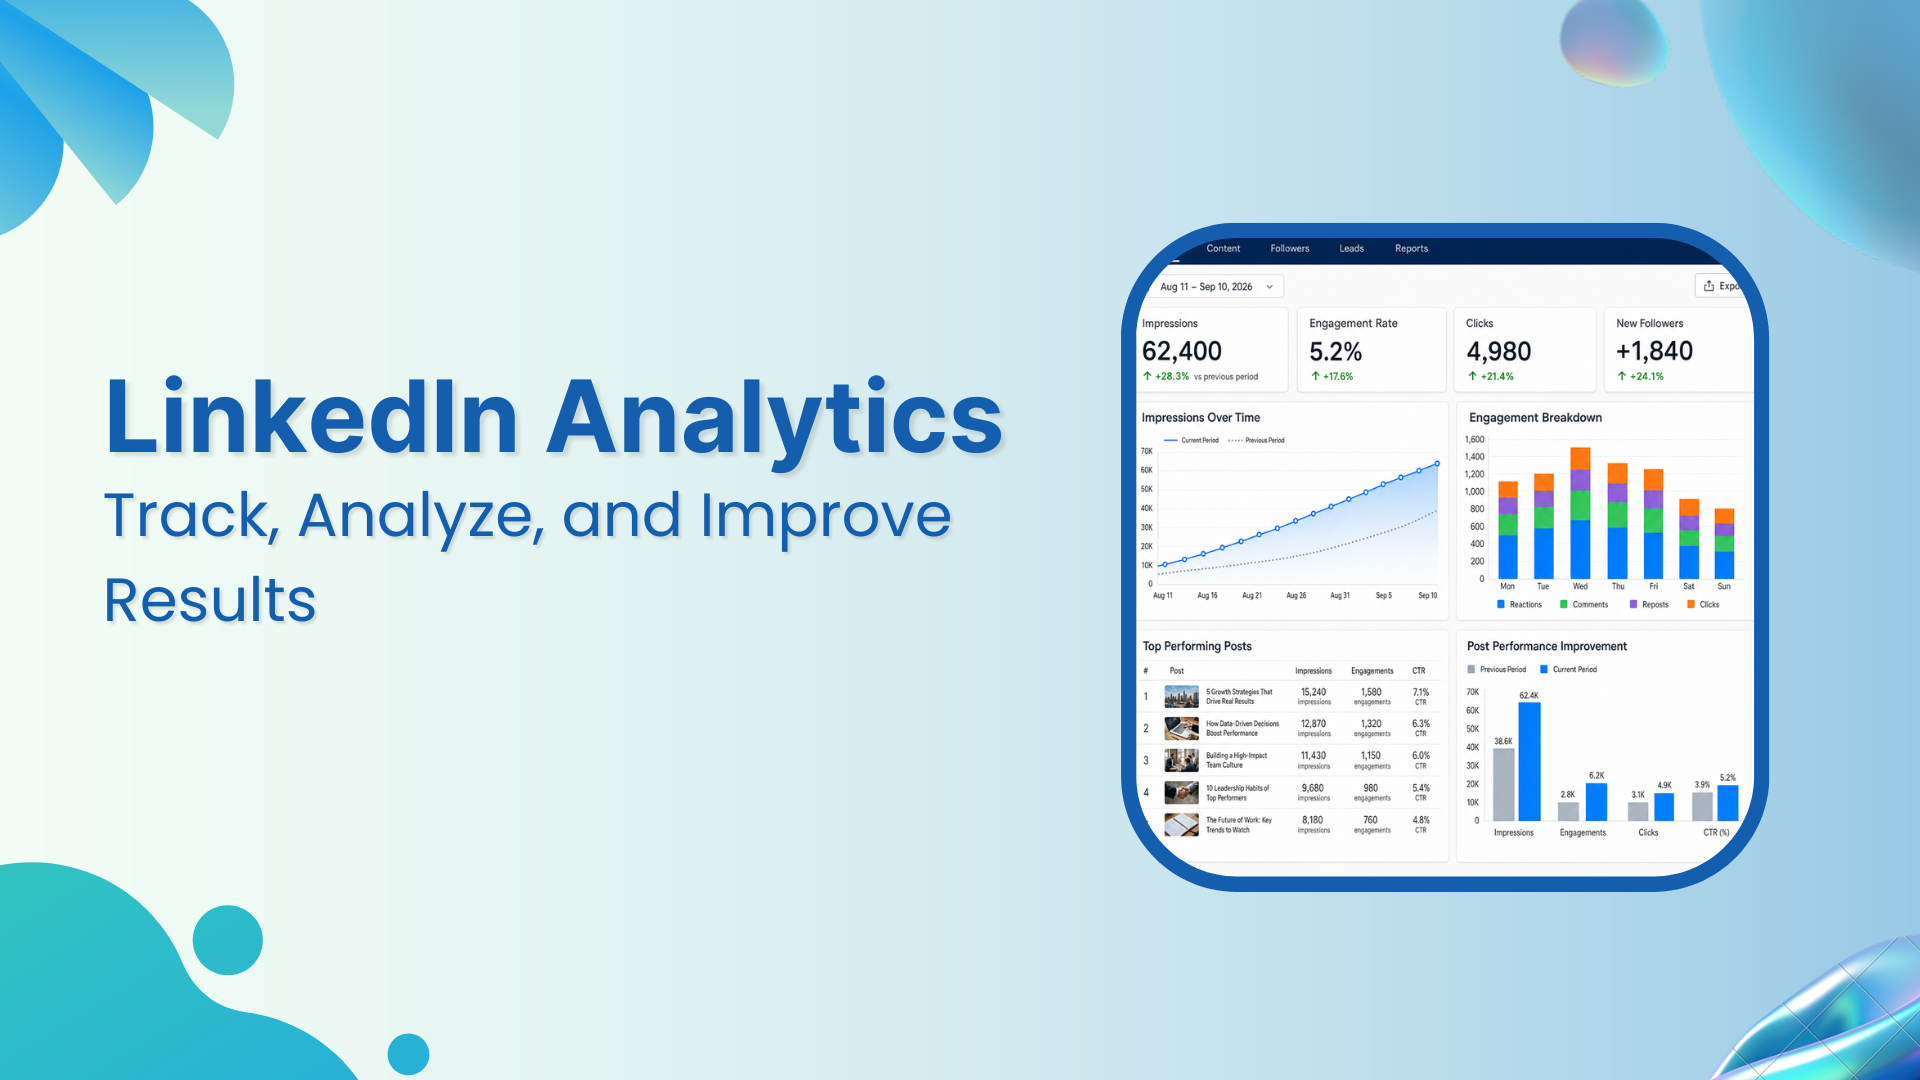
A useful LinkedIn analytics report does more than show whether a post received attention. It helps a team understand who saw the content, what they did next, whether the audience matched the people the business wants to reach, and what should change in the next publishing cycle.
That measurement work sits inside a wider LinkedIn marketing strategy that defines the audience, the commercial objective, and the channel’s role. Once a team knows what it is trying to achieve, a shared publishing and reporting workflow can make it easier to compare planned posts with the performance that followed.
This guide explains how to access and interpret data for individual posts, personal profiles, creators, and Company Pages. It also covers reporting, benchmarks, competitor analysis, ROI tracking, exports, dashboards, and the practical questions that turn LinkedIn data into better decisions.
Key takeaways
The points below summarise the reporting principles that matter most. The rest of this guide shows how to apply them in day-to-day analysis.
LinkedIn analytics is the performance data available for posts, personal profiles, creator activity, Company Pages, newsletters, lead-generation activity, and campaigns. It helps individuals and teams understand content distribution, audience response, page interest, follower composition, and the actions that may follow a visit or click.
For Company Pages, LinkedIn makes analytics available across areas such as content, visitors, followers, search appearances, leads, newsletters, competitors, and employer brand. The exact views available can depend on Page settings, role permissions, account type, and product updates, so teams should work from the options visible in their own admin view.
Useful reporting looks at performance in layers. Distribution tells you whether content appeared. Interaction shows whether people responded. Audience and visitor data help indicate who paid attention. Website and CRM data reveal whether that attention became a meaningful next step.
| Measurement layer | Question to answer | Useful signals |
|---|---|---|
| Distribution | Was the content shown often enough to assess? | Impressions, members reached, in-network and out-of-network distribution |
| Interaction | Did readers do more than scroll past? | Reactions, comments, reposts, clicks, and saves where available |
| Audience fit | Did the right people follow or engage? | Job function, seniority, industry, company size, and location |
| Profile and Page interest | Did the content lead people to investigate further? | Profile views, Page visitors, and search appearances |
| Website behavior | Did a visitor take a useful action after leaving LinkedIn? | UTM sessions, sign-ups, downloads, and demo requests |
| Business outcome | Did LinkedIn activity support a commercial or professional goal? | Qualified conversations, opportunities, partnerships, candidates, and pipeline influence |
The route to analytics depends on what you are measuring. Individual posts, personal profiles, creator accounts, Company Pages, newsletters, and paid campaigns each have their own views. Access can also depend on whether you are the account owner or have an eligible Page admin role.
Personal-profile data helps an individual understand the interest created by their activity and professional presence. From the profile area, LinkedIn may provide information about profile views, search appearances, post activity, and audience trends. The display can change over time, so it is sensible to review the current options inside the profile rather than relying on old screenshots.
Individual post analytics are usually the most useful starting point after publishing. Open the post and select the available analytics option to review how it was displayed and how readers interacted with it.
Creator analytics bring post performance and audience information together for members who have access to the feature. LinkedIn describes combined post analytics for content such as short-form posts, images, videos, events, polls, and articles, along with audience analytics that help creators understand who is following and engaging with their content.
Creators should use this view to identify patterns across several posts, rather than treating each update as a separate success or failure. A recurring topic, format, or audience segment can be more useful than a single high-performing post.
Company Page analytics provide a broader view of brand performance. From the Page admin view, administrators can open Analytics and move between the available sections, including content, visitors, followers, search appearances, leads, newsletters, competitors, and employer brand.
Each area answers a different question. The table below explains how a Page admin can turn the available tabs into practical decisions rather than simply monitoring numbers.
| Analytics area | What it helps you understand | Decision it supports |
|---|---|---|
| Content | Which posts and campaigns attracted useful attention over time | Repeat strong topics and reshape weak messages |
| Followers | Who follows the Page and how the audience is changing | Check whether growth is coming from the intended audience |
| Visitors | Who visits the Page and where they come from | Improve Page messaging, featured resources, and next steps |
| Search appearances | How often the Page appears in professional searches | Review whether Page language matches the audience and category |
| Leads | Activity tied to available lead-generation experiences | Compare lead quality with the audience and offer |
| Newsletters | Subscriber and content activity around recurring long-form publishing | Choose recurring topics that earn durable interest |
| Competitors | Follower and organic-content trends among selected Pages | Study patterns and market questions without copying another brand |
Post analytics explain how a single update performed. They are most useful when you remember the job that post was meant to do. A practical document may be successful because readers saved it. An opinion post may be successful because it prompted qualified discussion. A resource post may be successful because it sent the right people to a landing page.
Impressions count the number of times a post was displayed. Members reached estimates the number of distinct members and Pages that saw it, without repeat views. The two numbers should not be treated as interchangeable because one person can contribute more than one impression.
The comparison below helps teams understand how post visibility is distributed before they decide whether a result was genuinely broad or simply repeated among a smaller audience.
| Metric | What it measures | How to interpret it |
|---|---|---|
| Impressions | The number of times a post was shown | Useful for understanding display volume, including repeat exposure |
| Members reached | Estimated distinct members and Pages exposed to the post | Useful for understanding the breadth of the audience |
| In-network impressions | The share of displays from people who follow or are connected to you | Shows how much activity came from your existing professional network |
| Out-of-network impressions | The share of displays from people outside your network | Shows whether content is being discovered beyond current followers and connections |
If the difference between those numbers is causing confusion, our explanation of why one audience member can create several post impressions provides the detailed definition. The companion guide on unique people exposed to a post explains the audience-breadth side of the same report.
Engagement is not one thing. Each interaction can tell a different story, and the value depends on the content objective and the people taking part. A number without context can be misleading, especially for B2B teams that need relevant conversations rather than broad reactions.
Use the signals below as clues. The next step is always to inspect the quality of the audience and the action that followed.
| Interaction | What it may indicate | What to investigate next |
|---|---|---|
| Reactions | A quick positive response to the message or topic | Whether the people reacting fit the intended audience |
| Comments | A question, discussion, agreement, or objection | The quality, specificity, and account relevance of the discussion |
| Reposts | A willingness to share the idea with another network | Whether the repost adds context or reaches relevant people |
| Clicks | Interest in a resource, profile, link, or expanded content | Whether the destination led to useful website behavior |
| Saves | Potential reference value or future usefulness | Whether practical themes and structured formats deserve a follow-up |
Engagement rate is useful for comparing similar posts, but it is not a universal score of content quality. Teams should use one calculation consistently, state which actions are included, and compare posts with similar goals. Don’t judge a post aimed at conversation the same way you judge one designed to drive a resource download.
A common organic-post calculation is:
Engagement rate = (reactions + comments + reposts + clicks) ÷ impressions × 100
Some teams include saves or other actions when those figures are available. The exact formula matters less than consistency and context. Do not use a single industry benchmark as a verdict; compare your own similar posts over time and read the quality of the activity behind the percentage.
Click-through rate measures how often people clicked after a post was displayed. It can be helpful for posts that invite readers to visit a resource, register for an event, or explore a product page. It does not tell you whether the landing page was useful or whether the visitor took the intended action.
Click-through rate = link clicks ÷ impressions × 100
A stronger analysis follows the click-through to the website. UTM parameters, analytics events, and CRM records can show whether LinkedIn visitors read the page, downloaded a resource, subscribed, requested a demo, or entered a sales process.
Audience data tells you whether the Page or creator is attracting the people the content was intended to reach. Visitor and search information adds another layer: it shows whether the content or profile gave people enough reason to investigate the business further.
Follower analytics can reveal trends in job function, seniority, industry, company size, location, and other available demographic fields. The numbers are more useful when they are compared with the audience defined in your strategy. More followers are not automatically better if the growth is coming from people outside the market you need to reach.
Look at demographic changes over a month or quarter. A single week is often too short to show whether a content change is shifting audience quality.
More Page visitors can be encouraging, but the Page must answer the visitor’s basic questions quickly. What does the company do? Who does it help? Why should someone follow or continue to the website? If visitor growth does not translate into follows, clicks, or deeper engagement, the Page message or featured resources may need attention.
The next step is not another reporting metric. It is improving the information a visitor sees first. Our guide to making a Company Page clearer for prospective customers covers the Page elements that can turn curiosity into a more useful next step.
Search appearances and profile views can indicate professional curiosity. They do not show purchase intent on their own, but they can show whether your content is leading people to investigate your credentials, experience, and role. A pattern of profile visits from relevant roles can be more useful than a broad increase from an unrelated audience.
When profile interest rises, the profile should make that attention count. This guide to turning profile views into a stronger professional first impression can help align the headline, About section, proof, and featured resources with the audience you want to attract.
Competitor analytics can help Page administrators compare follower and organic-content patterns across selected company Pages. The purpose is not to copy a competitor’s posting schedule or imitate a format because it appears to work for them. It is to understand the market conversations, content gaps, and audience questions that may deserve a better answer from your brand.
A disciplined competitor review looks for patterns in the value being offered, not just counts. The framework below keeps the review tied to content and audience insight.
| What to review | Question to ask | How to use the insight |
|---|---|---|
| Audience growth | Which types of professionals appear to be joining the Page? | Identify audience segments that may be relevant but overlooked |
| Content themes | Which subjects recur in the competitor’s strongest posts? | Look for unanswered questions or a different point of view |
| Format choices | How are text, documents, video, and other formats being used? | Consider whether a format could clarify one of your own ideas |
| Comment threads | What questions, frustrations, and objections appear repeatedly? | Use the language as audience research, not copy |
| Offers and CTAs | What next steps are being offered, and at which stage? | Check whether your own CTA matches the likely reader intent |
| Trending content | Which original posts are attracting attention now? | Study the pattern and create an original response grounded in your expertise |
Exports are useful when a team needs to compare periods, combine LinkedIn results with website or CRM data, prepare a stakeholder update, or retain a historical record outside the platform. The exact export options can vary by analytics view, Page role, and LinkedIn product changes, so start from the export or download option visible in your own analytics dashboard.
A useful report should not try to show every available number. It should tell a short, evidence-based story: what happened, why it may have happened, and what the team will do next. The structure below works for a monthly Page, creator, or campaign review.
| Report section | What to include | Why it is useful |
|---|---|---|
| Objective | The business or audience goal for the period | Keeps the report tied to a purpose |
| Executive summary | Three to five facts about the period and the main learning | Helps stakeholders understand the result quickly |
| Content performance | Top and bottom posts, themes, formats, and quality of interaction | Shows what the audience responded to |
| Audience movement | Follower, visitor, demographic, and target-account patterns | Shows whether the right audience is building |
| Website and lead activity | UTM sessions, conversions, resource requests, or qualified conversations | Connects social activity with downstream outcomes |
| Competitor context | One or two meaningful market observations | Adds context without turning the report into a competitor scorecard |
| Next actions | What to repeat, improve, stop, or test next month | Makes the report operational |
A dashboard should make recurring decisions faster. It works best when it shows a small set of measures that connect to a stated objective, rather than every metric available in an export. A dashboard for a B2B content team, for example, should make audience fit and qualified activity visible alongside distribution.
The dashboard below is a practical starting point. It can be built in a spreadsheet, reporting tool, or shared workspace, depending on the number of accounts and stakeholders involved.
| Dashboard area | Recommended view | Decision it supports |
|---|---|---|
| Content performance | Posts by topic, format, reach, engagement quality, and clicks | Which content should be repeated or reshaped? |
| Audience quality | Follower and visitor demographics, target-account activity, and profile interest | Are we attracting the people we need to reach? |
| Conversion activity | UTM sessions, downloads, registrations, demos, and qualified messages | Is social attention leading to a useful next step? |
| Trend view | Monthly change in selected core metrics | Is the strategy improving over time? |
| Test log | Topic, hook, format, CTA, timing, outcome, and lesson | What did the team learn from controlled experiments? |
LinkedIn ROI is rarely captured by one post and one click. B2B buying journeys often involve several people, several channels, and a period of research before a sales conversation. The goal is not to claim perfect attribution. It is to create a consistent record of LinkedIn-assisted activity and use it alongside other marketing and CRM data.
A practical ROI process starts with the customer journey. You need to identify the actions that matter before a sale, such as a guide download, webinar registration, pricing-page visit, product-demo request, or qualified message. Then use UTM parameters and CRM source fields to connect those actions with the LinkedIn post or campaign that contributed to them.
The framework below links LinkedIn activity to progressively stronger signals. It helps teams avoid treating every reaction as revenue while still recognizing the value of early research and relationship building.
| Stage | Evidence to track | Question to ask |
|---|---|---|
| Awareness | Members reached, relevant follower growth, and target-account visibility | Are the right people becoming aware of us? |
| Engagement | Useful comments, saves, reposts, profile visits, and qualified replies | Are relevant people showing meaningful interest? |
| Consideration | Resource clicks, landing-page behavior, event registrations, and repeat visits | Are people researching our approach more deeply? |
| Conversion | Demo requests, trials, meetings, qualified forms, and sales conversations | Are the right prospects taking a higher-intent action? |
| Revenue influence | Opportunities, pipeline, and closed revenue with LinkedIn touchpoints | Did LinkedIn contribute to the buying journey? |
Native LinkedIn analytics are the right starting point for understanding a single profile or Page. A third-party tool becomes more useful when the team needs to combine several social networks, manage several brands, prepare recurring stakeholder reports, compare campaigns, coordinate publishing approvals, or view performance beside the calendar that produced the content.
The decision should follow the reporting problem. The comparison below can help teams choose the level of reporting support that fits their operation.
| Reporting need | Native LinkedIn data | Third-party reporting platform |
|---|---|---|
| Review one profile or Page | Often sufficient | May be unnecessary |
| Evaluate one post or short content period | Often sufficient | Useful when comparing several accounts |
| Track Page audience and competitor views | Available for eligible Page admins | Useful for combined reporting across brands or networks |
| Connect social data with other channels | Limited within LinkedIn itself | Often more practical in a broader reporting workflow |
| Create recurring stakeholder or client reports | Manual exports may be enough for small teams | Useful for scheduled, branded, or multi-account reports |
| Manage planning, approvals, publishing, and reporting together | Not designed as an all-in-one workflow | Useful when operational context matters alongside performance data |
If your team needs to compare options before adding another platform, this breakdown of reporting tools for LinkedIn campaigns and Page performance can help you assess the available features against your workflow.
ContentStudio can support teams that need planning, approvals, publishing, and reporting in one shared environment. The value is not another dashboard. It is the ability to connect what the team intended to publish, what actually went live, and what it learned from the response.
A reporting process works best when it has two speeds. A brief weekly review captures fresh context, while a monthly review gives the team enough data to spot patterns and make strategic decisions. The routine below keeps reporting manageable without letting useful details disappear.
The weekly check should be short and practical. Its purpose is to capture audience questions, unexpected reactions, and promising content patterns while the team still remembers the context behind each post.
The monthly review should look beyond one post and identify repeated behavior. This is where a team decides which topics, formats, offers, and audience segments deserve more attention in the next content cycle.
The table below turns common reporting patterns into practical next actions.
| What you observe | What it may mean | What to do next |
|---|---|---|
| High impressions but weak relevant interaction | The post was distributed, but the message may not have resonated with the intended audience | Narrow the problem, strengthen the practical value, or improve the fit between topic and audience |
| Practical posts are saved often | Readers may value the content as a reference | Create a follow-up framework or a deeper supporting resource |
| Reactions are strong, but clicks are weak | The message was agreeable, but the resource or CTA may not be compelling | Review the offer, CTA wording, and landing-page relevance |
| Page visits increase but follows stay flat | Visitors may not understand why they should continue following | Clarify the Page promise and feature more useful resources |
| Target accounts engage but do not convert | The audience may be researching rather than ready to buy | Continue education and provide a lower-friction next step |
| The same question appears repeatedly | The audience has an unresolved information need | Create a direct answer post, guide, or sales-enablement resource |
Content results should shape what comes next. The guide to using performance insights to plan the next month of posts shows how a team can turn recurring data patterns into a stronger editorial plan.
Analytics become less useful when numbers are separated from the audience, the post objective, and the business decision. The mistakes below often produce busy reports without producing better content or better outcomes.
| Mistake | Why it weakens the analysis | Better approach |
|---|---|---|
| Treating impressions as unique audience reach | Repeat displays can make a post look broader than it was | Compare impressions with members reached and audience quality |
| Using one engagement benchmark for every post | Goals, formats, industries, and audience sizes differ | Compare similar posts over time and read the quality of response |
| Looking only at reactions | A reaction says little about relevance or next-step intent | Review comments, account fit, clicks, saves, and downstream activity |
| Judging a post on publication day only | Useful interactions and website actions may appear later | Capture a weekly view and look for monthly patterns |
| Comparing all formats using one metric | A document, video, opinion post, and resource post may do different jobs | Define the intended outcome before publishing |
| Ignoring follower and visitor demographics | Growth can conceal a poor audience fit | Review the roles, industries, locations, and seniority levels appearing over time |
| Skipping UTM tracking | Clicks cannot be connected to website actions or conversions | Use consistent parameters on relevant destinations |
| Copying competitor metrics | A competitor may have a different audience, offer, budget, or content model | Study the audience value they create and adapt the lesson to your own strategy |
Before the next reporting cycle, use this checklist to make sure the data will lead to an action rather than another dashboard no one uses.
LinkedIn analytics become valuable when they help the team decide what to do next. A useful report shows whether the right people are discovering the content, whether those people are taking meaningful actions, and where the next publishing cycle should improve.
Start with a simple process: review post-level context each week, review audience and outcome trends each month, connect important links to website and CRM data, and document one or two focused tests for the next period. Over time, that habit turns LinkedIn reporting into a practical decision-making system rather than a collection of disconnected numbers.
LinkedIn analytics is the performance data available for posts, personal profiles, creator activity, Company Pages, newsletters, lead generation, and campaigns. It can show content distribution, engagement, audience demographics, visitor interest, search appearances, and other signals that help individuals and teams make better decisions.
For a Company Page, open the Page in admin view and select Analytics. For an individual post, open the post and use the available analytics option. You can access personal profile and creator insights in the areas where LinkedIn provides profile, post, and audience information.
Yes, LinkedIn may provide profile views, search appearances, post analytics, and audience information for personal profiles and creators. The exact options can vary by account type and feature availability, so use the analytics views shown in your current profile experience.
Company Page administrators can access available views for content, visitors, followers, search appearances, leads, newsletters, competitors, and employer brand. The options vary by Page role, settings, and feature availability.
Impressions count the number of times a post was shown. Members reached estimates the number of distinct members and Pages exposed to it. One member can see a post more than once, so impressions can be higher than the number of members reached.
A common calculation divides engagement actions by impressions and multiplies the result by 100. The engagement actions included can vary, so use one documented formula when comparing similar posts. The percentage should always be reviewed alongside audience quality and the intended goal of the content.
Not always. Native data may be enough for a single profile or Company Page. A third-party tool is more useful when a team needs multichannel reporting, several accounts, recurring stakeholder reports, shared access, automated exports, or a connected planning and publishing workflow.
B2B teams can use UTM parameters, analytics events, CRM source fields, and sales records to connect LinkedIn activity with resource downloads, event registrations, qualified messages, meetings, opportunities, and pipeline influence. The goal is to understand contribution across a longer buying journey, not claim that every sale came from one post.
Start with the reporting objective, then include a concise summary, content results, audience trends, website or lead activity, competitor context where useful, and clear next actions. A good report explains what happened, why it may have happened, and what the team will test or change next.
Plan 0 Days of Content in 0 Minutes
Create, schedule, publish and analyze your content across all your social media channels from one simple dashboard.
4.7 on Capterra • 16,500+ marketers trust ContentStudio
Arooj Ishtiaq is a Content Marketing Strategist with 5+ years of experience writing about social media, SaaS, and AI. At ContentStudio, she creates practical guides, tutorials, and how-to content that help marketers navigate social media trends, sharpen their strategies, and get more from their content.
View all posts by Arooj IshtiaqRecommended for you
LinkedIn Company page guide: How to create, optimize, and grow it
LinkedIn marketing in 2026: Strategy, content, and growth

How to see scheduled posts on LinkedIn | Step-by-step
How to Use LinkedIn Hashtags Without Overdoing It