We've built a simple AI-powered alternative to Google analytics (GA4). Try Usermaven for freehere.

9 best product analytics tools for 2024

blog author
Published by Mahnoor Shahid
Jul 22, 2024
27 minutes
blog

Staring at your SaaS product with crossed fingers, hoping users will magically love it, is a recipe for disaster. 

Today, we have superpowers at our fingertips – product analytics tools! 

These tools are like microscopes for websites and apps, showing us exactly how users click and scroll.

There are many options, but don’t worry! We’ll explore the best ones to find the perfect fit for you, whether you’re a product pro or new to data.

Get ready to ditch the guessing game and build a product users will truly love!

What are product analytics?

Product analytics refers to the process of collecting, analyzing, and interpreting data related to how users interact with and use a product or service. The primary goal of product analytics is to gain insights that can inform product strategy, drive feature development, optimize user experience, and ultimately improve key metrics such as user engagement, retention, and revenue.

Product analytics keeps tabs on how people actually use your app. It tracks things like:

  • What buttons do they click the most?
  • Where do they get stuck?
  • Do they find what they’re looking for easily?

How do product analytics tools work?

Product analytics tools typically work by enabling companies to collect, process, and analyze user data from their digital products and services. Here’s a general overview of how these platforms operate:

  1. Data collection: They provide SDKs (software development kits) to capture user interactions and events from websites, mobile apps, etc.
  2. Data modeling: Analysts define metrics, funnels, cohorts, and other constructs relevant to their product.
  3. Visualization: Dashboards and reports allow teams to explore and visualize processed data through charts, funnels, and trends.
  4. Segmentation: Data can be filtered and segmented based on user properties and behaviors.
  5. Integration: Connect with other tools like CRM, marketing automation for comprehensive analysis.
  6. Collaboration: Role-based access controls for different team members to access and analyze data.

The overall goal of product analytics tools is to provide a centralized and user-friendly way to collect, process, analyze, and act on user behavior data, enabling data-driven product decisions and optimizations.

Must-have features to look out for in product analytics tools

FeatureDescription
User behavior trackingAbility to track user actions, events, and behavior within the product or application.
Funnel analysisVisualization and analysis of user flows through different stages or steps within the product.
Cohort analysisSegmentation of users based on specific characteristics or actions and tracking their behavior over time.
Retention analysisMetrics and insights related to user retention, churn, and engagement levels.
Event trackingAbility to define and track custom events within the product or application.
Data segmentationSlicing and dicing data based on various user properties, device types, locations, etc.
Data visualizationInteractive dashboards and visual representations of data for easy analysis.
Integration capabilitiesAbility to integrate with other tools and data sources, such as CRMs, marketing automation platforms, etc.
Data privacy and securityRobust data privacy and security measures to protect user data and comply with regulations.
Real-time reportingAbility to view and analyze data in real-time or near real-time.
Customizable reportingFlexibility to create custom reports and dashboards tailored to specific needs.

9 best product analytics tools

Choosing the right product analytics tool is crucial for understanding how users interact with your product.

We’ll dive into 9 of the best product analytics tools to help you uncover valuable user insights, including:

  • Usermaven
  • Mixpanel
  • Amplitude
  • Heap
  • Kissmetrics
  • Posthog
  • Indicative
  • Woopra
  • Pendo

Let’s explore their unique strengths and weaknesses and how they can empower you to optimize your product for success.

1. Usermaven

Usermaven

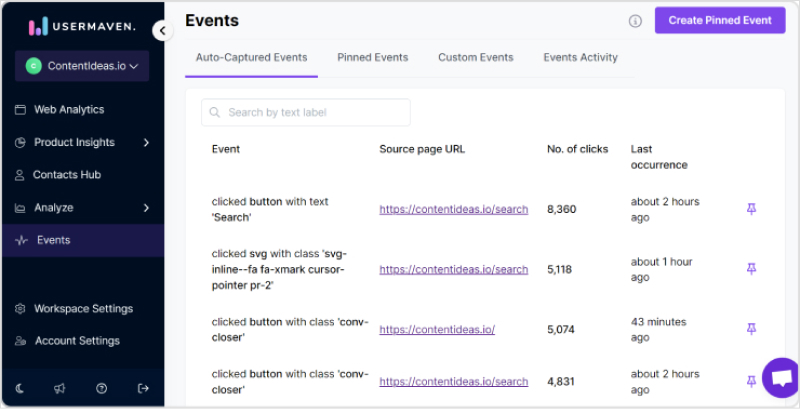
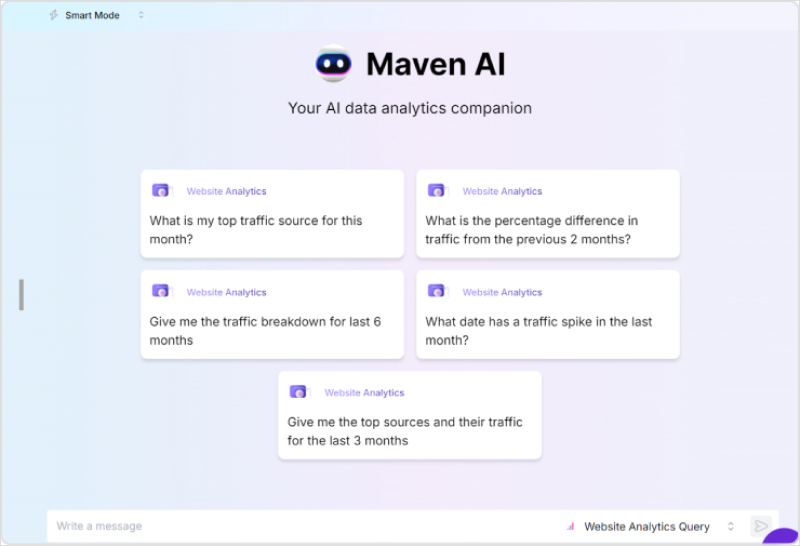
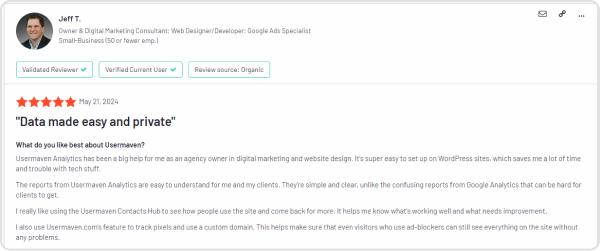
“Forget drowning in data. Meet Usermaven: The product analytics analytics tool built for clarity, not complexity.”

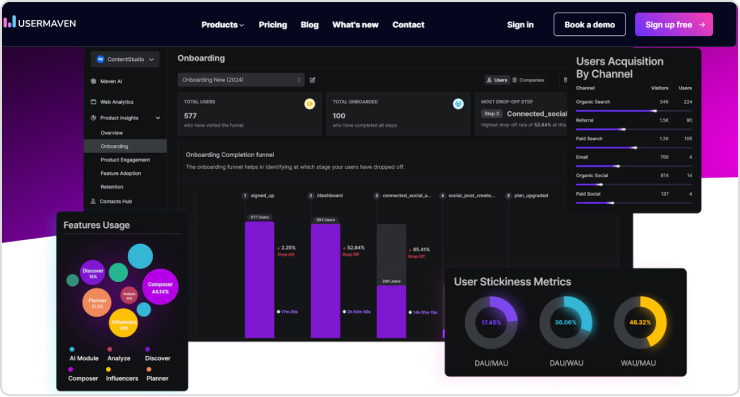
Usermaven has become a game-changer in the product analytics world. This product analytics tool empowers businesses of all sizes to truly understand how users interact with their products.

It seamlessly integrates with your product or app, eliminating the need for complex coding and ensuring you capture every user interaction from the initial click to the final conversion (or exit).

Usermaven doesn’t stop there. Unlike clunky analytics tools, Usermaven boasts a user-friendly interface that anyone can navigate. No technical expertise is required to get up and running, allowing you to unlock the hidden potential within your data.

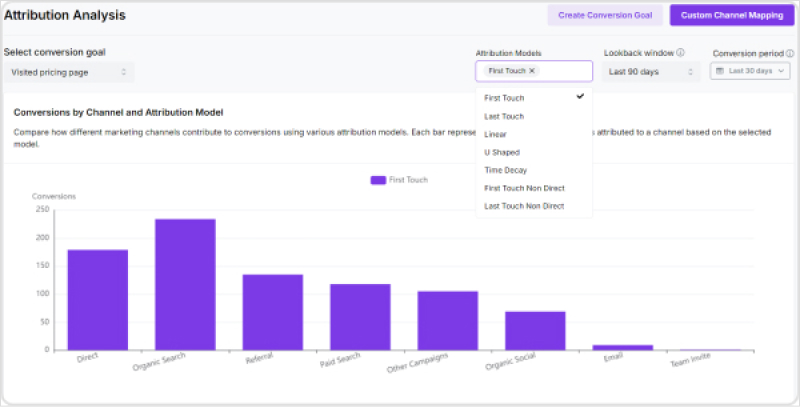
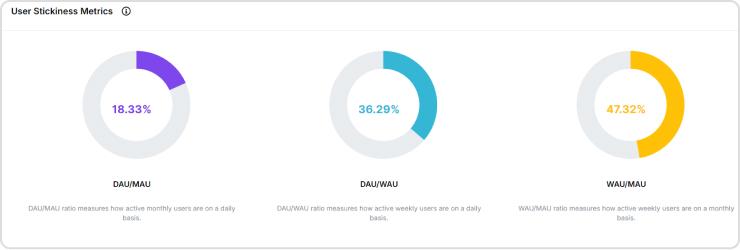
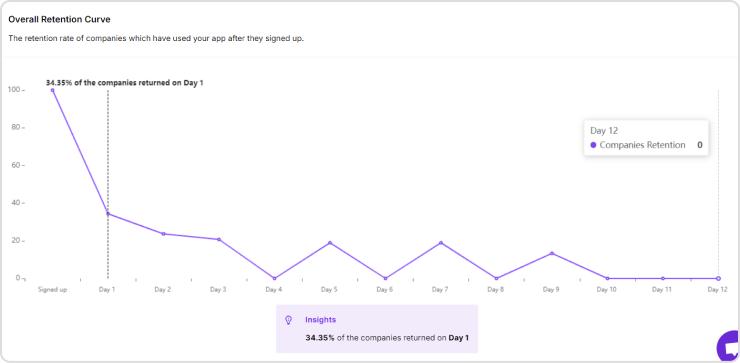
Usermaven presents information through clear visualizations and intuitive tools. This empowers you to identify user trends, pinpoint areas for improvement, and ultimately optimize your product for success.

In the coming sections, we’ll explore the specific features that make Usermaven such a powerful product analytics tool…

Features

  • Automatic event tracking: Usermaven seamlessly captures user interactions like clicks, form submissions, and page visits. This ensures you have a complete picture of how users engage with your product without any manual setup.
Automatic event tracking
  • Visualized funnels: Usermaven allows you to pinpoint drop-off points and identify areas that are ripe for optimization by funnel analysis. Imagine visualizing exactly where users abandon your signup process or shopping cart, empowering you to streamline the user experience.
Visualized funnels
  • AI-powered Maven AI: Get instant access to valuable insights with Usermaven’s built-in AI assistant. Ask questions in natural language, and Maven AI delivers insightful answers directly within the platform. Need to know which feature drives the most conversions? Simply ask Maven AI and get the data you need to make informed decisions quickly.
Maven AI
  • Multi-touch attribution: Understand the true impact of your marketing efforts. Usermaven tracks every customer touchpoint across various channels, offering seven attribution models (first-touch, last-touch, U-shaped, first-touch nondirect, last-touch nondirect, linear, and time decay). This comprehensive analysis allows you to see which marketing initiatives are driving the most conversions, enabling you to optimize your marketing budget and maximize ROI.
Attribution analysis
  • End-to-end journey mapping: No more piecing together fragmented visitor data. Usermaven provides a comprehensive view of a user’s entire journey on your website or app. This intuitive visualization product analytics tool empowers you to identify user navigation patterns, pinpoint drop-off points, and pinpoint areas for improvement.
User journey's mapping
  • Segmentation: Create user segments based on specific criteria like demographics, behavior, or interests. This allows you to target specific user groups with personalized experiences and marketing campaigns.
Segmentation
  • Contact hub: Centralize and manage all your visitors and users’ details within Usermaven. This can include website behavior, email interactions, and support tickets. With a unified view of your users, you can provide more personalized and effective customer service.
  • Feature adoption: Track how users are adopting new features within your product. This data can help you identify areas where users might need additional training or guidance and ensure your new features are delivering value.
Feature adoption
  • Onboarding: Gain insights into how users are progressing through your onboarding process. Usermaven can help you identify bottlenecks and optimize your onboarding flow to improve user retention.
Onborading process

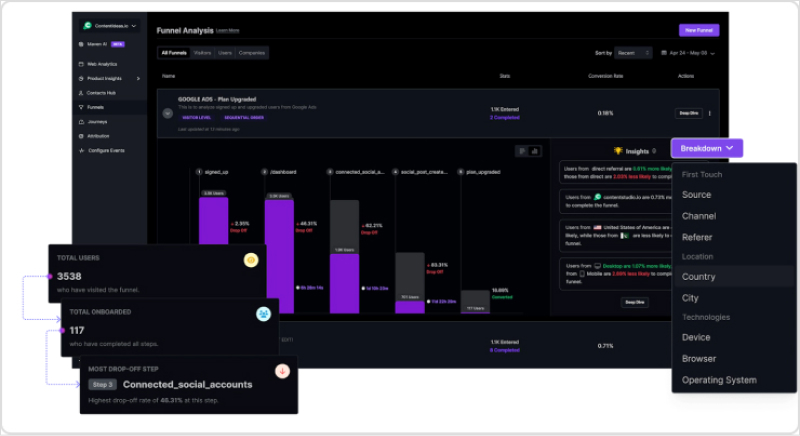
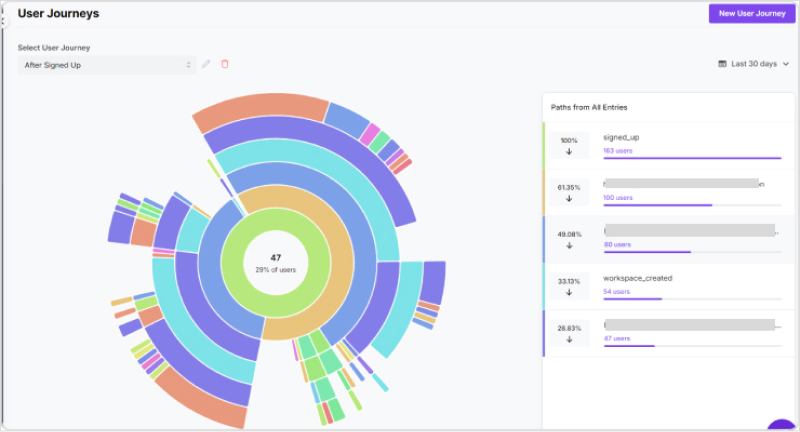
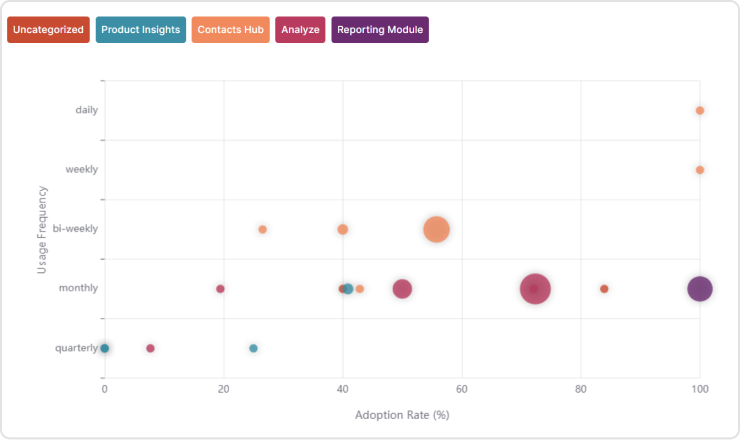
Usermaven even helps you identify “power users” – highly engaged individuals who can offer valuable insights on user satisfaction.

User stickiness metrics
  • Retention metrics: The retention curve in Usermaven tracks how user retention changes over time, allowing you to pinpoint critical moments for intervention. Usermaven also offers cohort analysis to track user groups based on signup date and see how their retention evolves.
Retention metrics

Flexible pricing

  • Free trial: Get started risk-free with a 30-day trial offering full access to all features.
  • Pro plan ($14/month): This plan caters to basic website analytics needs.
  • Premium plan ($24/month): Upgrade to the Premium Plan for advanced analytics and CRM functionalities.
  • Enterprise plan: For high-traffic websites and specific hosting requirements, Usermaven offers custom-priced Enterprise plans.

Review

User review Usermaven

If you’re still relying on GA4 as a product analytics tool, you’re in the wrong hands. See how Usermaven offers everything a modern product analytics tool should have:

2. Mixpanel

Mixpanel

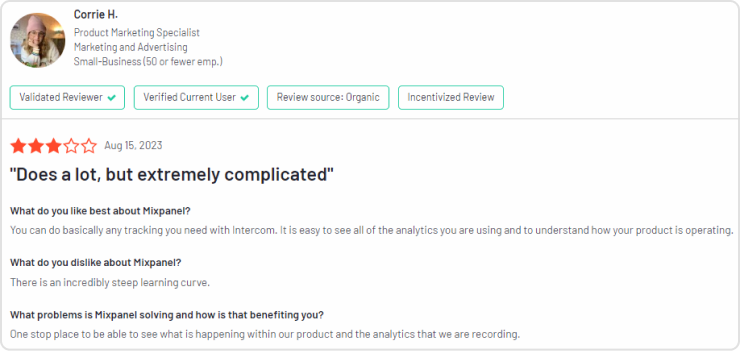
Mixpanel: Like a mind-reader for your users. See what makes them tick (and click)!

Mixpanel is a powerful product analytics tool designed to help businesses understand user behavior, drive engagement, and improve their products. It provides in-depth insights into how users interact with your products, enabling data-driven decisions to enhance user experience and increase conversions.

Features

  • User analytics: Tracks user interactions with your product, offering insights into user behavior, retention, and lifetime value.
  • Funnels: Visualizes the user journey to identify drop-off points and optimize conversion paths.
  • Segmentation: Allows users to be segmented based on various attributes and behaviors for targeted analysis.
  • Retention analysis: Analyze how well your product retains users over time.
  • Real-time data: Provides real-time analytics to make timely decisions.
  • Integrations: Integrates with other tools such as CRMs, email marketing platforms, and data warehouses.
  • Data visualization: Offers robust data visualization tools for easy interpretation of complex data.
  • Cohort analysis: Helps understand user behavior over time by grouping users with similar characteristics.

Here is the table summarizing the pros and cons of Mixpanel as a product analytics tool;

ProsCons
User-friendly interfaceExpensive for small businesses or startups with limited budgets.
Comprehensive analyticsAdvanced features are complex and have a steep learning curve for beginners.
Real-time insightsThe free plan has limitations that might not suit growing businesses.
ScalabilityFor very large datasets, Mixpanel may sample data, affecting accuracy.

Pricing

Mixpanel offers a tiered pricing model:

  1. Free plan: Basic analytics with limited features, suitable for small projects or startups.
  2. Growth plan: Starting at $28/month, this plan includes advanced analytics, data modeling, and increased data limits. Pricing can scale based on usage and additional features.
  3. Enterprise plan: Custom pricing tailored to large organizations with extensive needs, offering full access to all features, dedicated support, and advanced security options.

Review

user review Mixpanel

3. Amplitude

Amplitude

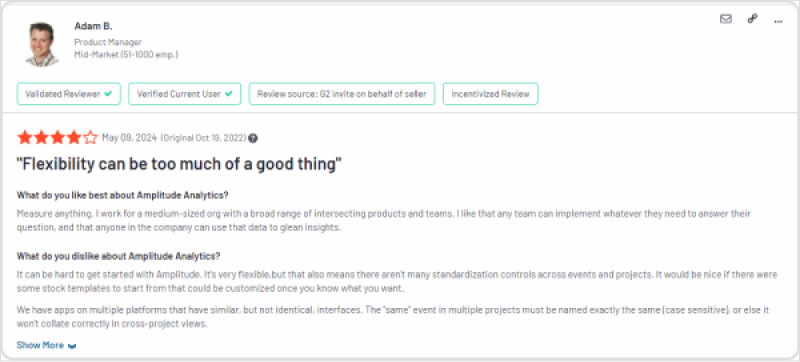
Amplitude: Turn user data into growth. It’s not magic; It’s analytics.

Amplitude is a comprehensive product analytics tool platform designed to help businesses understand user behavior, optimize product experiences, and drive growth. It offers a suite of tools to analyze user actions, track key metrics, and uncover insights that inform product development and marketing strategies.

Features

  • Event tracking: Monitors user interactions and events within your product for detailed analysis.
  • Behavioral cohorts: Allows users to be segmented based on specific behaviors and attributes.
  • Funnels analysis: Visualizes the conversion paths to identify where users drop off and how to improve conversion rates.
  • Retention analysis: Evaluate how well your product retains users over time.
  • Pathfinder: Maps out user journeys to understand how users navigate through your product.
  • User segmentation: Enables the creation of detailed user segments for targeted analysis and marketing.
  • Product intelligence: Leverages machine learning to provide predictive analytics and deeper insights.

Here is the table summarizing the pros and cons of amplitude as a product analytics tool:

ProsCons
Comprehensive analysisPricing can be higher, which might be a challenge for small businesses and startups.
User-friendly interfaceA steep learning curve that can take significant time and effort.
ScalabilityHighly customizable features may require extensive setup and maintenance.
Robust integrationsIntegrating with existing systems can be complex and may require technical assistance.
Predictive analyticsHandling sensitive data with predictive analytics might raise privacy issues.

Pricing

Amplitude offers a tiered pricing model:

  1. Starter plan: Free, includes limited analytics features, suitable for small teams and projects.
  2. Plus plan: Starts with $49/ month. 
  3. Growth plan: Custom pricing designed for growing teams.
  4. Enterprise plan: Custom pricing tailored to the needs of large organizations, offering full access to all features.

Review

User review Amplitude

4. Heap

Heap

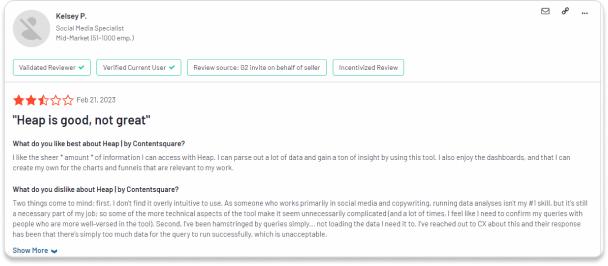
Heap: Forget coding, understand users. Automatic analytics for frictionless insights.

Heap is a product analytics tool that automatically captures every user interaction with your product and mobile applications, allowing businesses to analyze user behavior without the need for manual tracking. Its auto-capture technology provides a comprehensive view of user interactions, enabling data-driven decisions to enhance product experiences and drive growth.

Features

  • Automatic data capture: Automatically tracks all user interactions and events without manual instrumentation.
  • Behavioral analytics: Provides deep insights into user behavior and engagement patterns.
  • Event visualizer: Allows for easy creation and management of custom events through a visual interface.
  • Funnel analysis: Visualizes user journeys to identify conversion rates and drop-off points.
  • Retention analysis: Evaluate how well your product retains users over time.
  • User segmentation: Enables detailed segmentation of users based on behaviors and attributes.
  • Cohort analysis: Tracks user cohorts over time to understand retention and engagement trends.

Here is the table summarizing the pros and cons of heap as a product analytics tool:

ProsCons
Ease of useInitial setup can be costly despite the ease of use.
Comprehensive dataIntegrating with some third-party tools can be difficult.
Detailed segmentationThe free plan offers limited customization options.
Real-time analyticsOccasionally, real-time data can experience slight delays.
Strong integrationAbundance of features can lead to confusion for new users.

Pricing

Heap offers a tiered pricing model:

  1. Free plan: Includes core analytics features with limited data capture.
  2. Growth plan: Custom pricing based on data volume and additional features.
  3. Pro plan: Custom pricing for businesses that need extensive analytics capabilities.
  4. Premier plan: Tailored for large enterprises, offering full access to all features.

Review

User review Heap

5. Kissmetrics

Kissmetrics

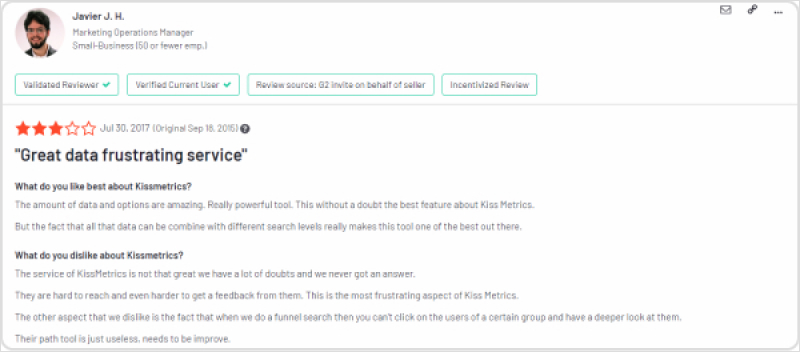
Kissmetrics: Beyond understanding your customers. Get actionable insights to make them love you.

Kissmetrics is a powerful product analytics tool and customer engagement platform designed to help businesses understand, analyze, and improve their customer journey. It provides detailed insights into user behavior, enabling companies to optimize their marketing strategies, enhance user experiences, and drive growth through actionable data.

Features

  • Customer journey tracking: Tracks individual user journeys across web and mobile platforms.
  • Behavioral analytics: Analyzes user behavior to identify trends and patterns.
  • Funnel reporting: Visualizes conversion funnels to pinpoint where users drop off.
  • Cohort analysis: Groups users with similar behaviors to analyze retention and engagement.
  • Segmentation: Segment users based on various attributes and behaviors for targeted analysis.
  • Revenue reporting: Links user behavior to revenue to measure the impact of marketing efforts.
  • Email campaigns: Integrates with email marketing tools to automate and measure the effectiveness of campaigns.

Here is the table summarizing the pros and cons of Kissmetrics as a product analytics tool:

ProsCons
Comprehensive user trackingPrice increases significantly with higher usage tiers.
Revenue attributionHandling sensitive revenue data may raise privacy issues.
SegmentationSome features may overlap, leading to unnecessary complexity.
Integration capabilitiesCustom integrations can be restricted or require additional development.

Pricing

Kissmetrics offers a tiered pricing model:

  1. Silver plan: Starting at $199/month for small teams.
  2. Gold plan: $499/ month for medium-sized teams. 
  3. Platinum plan: Custom pricing for large enterprises.

Review

kissmetrics user review

6. PostHog

Posthog

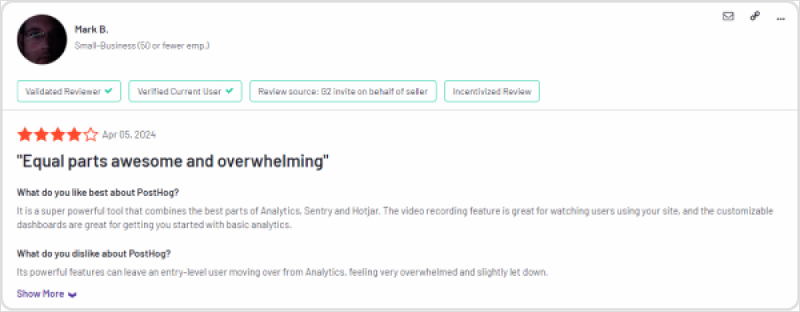
PostHog: See how users really use your product. No strings are attached (Except for the code, maybe).

PostHog is an open-source product analytics tool designed to provide comprehensive insights into user behavior, helping businesses make data-driven decisions to improve their products. It offers robust features for tracking, analyzing, and optimizing user interactions without the need for extensive engineering resources. As an open-source solution, PostHog can be self-hosted, providing greater control and customization for businesses.

Features

  • Event tracking: Automatically captures user interactions and events within your product.
  • User analytics: Provides detailed insights into individual user behavior and journeys.
  • Funnel analysis: Visualizes user paths and conversion funnels to identify drop-off points.
  • Session recording: Records user sessions to visually analyze user interactions and identify pain points.
  • Feature flags: Allows A/B testing and gradual feature rollouts for experimentation and optimization.
  • Heatmaps: Visualizes user interactions on web pages to identify popular and ignored areas.
  • Self-hosting: Offers self-hosting options for greater data control and privacy.

Here is the table summarizing the pros and cons of Posthog as a product analytics tool:

ProsCons
Open sourceSelf-hosting can require significant technical expertise and resources.
Self-hosting optionAdvanced features may require some time to master.
Comprehensive feature setCommunity support may not be as comprehensive as dedicated support from proprietary solutions.
ScalabilitySelf-hosting can be resource-intensive in terms of maintenance and infrastructure management.

Pricing

PostHog offers several pricing tiers:

  1. Free plan: No credit card required, basic product features, 1 project, 1 year data retention.
  2. Ridiculously cheap plan: Starts at $0/month. Pay only for what you use, with options like $0.00005/event for product analytics and so on.
  3. Enterprise plan: Custom pricing with fixed terms. 

Review

Posthog review

7. Indicative

Indicative

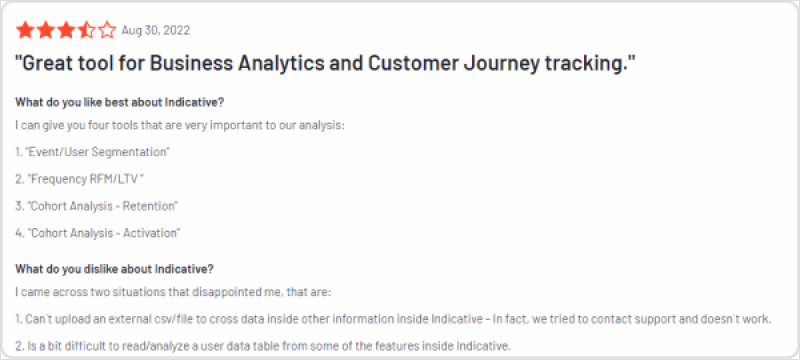
Indicative: See the whole picture. User journeys made clear across every channel.

Indicative is a comprehensive product analytics tool focused on helping businesses understand their customers’ journey across multiple channels. It provides powerful tools for analyzing user behavior, tracking key metrics, and uncovering insights that drive growth and improve user engagement. Indicative is particularly known for its user-friendly interface and the ability to integrate data from various sources.

Features

  • Customer journey mapping: Tracks and visualizes the entire customer journey across different channels and touchpoints.
  • Behavioral analytics: Analyzes user actions and behaviors to identify trends and patterns.
  • Funnel analysis: Creates and analyzes funnels to understand conversion rates and identify drop-off points.
  • Segmentation: Segment users based on specific attributes and behaviors for more targeted analysis.
  • Cohort analysis: Groups users into cohorts to analyze retention and engagement over time.
  • Path analysis: Visualizes user paths to uncover common navigation patterns and optimize user flow.
  • Multi-channel data integration: Integrates data from various sources such as web, mobile, CRM, and marketing tools.

Here is the table summarizing the pros and cons of indicative as a product analytics tool:

ProsCons
Multi-channel trackingAccess to advanced enterprise features may incur high costs.
User-friendly interfaceIntegrating with certain legacy systems can be challenging.
Comprehensive analyticsRequires significant computational resources for real-time analysis.
Real-time insightsScaling to handle very large datasets can be challenging.
Customizable dashboardsAPI customization options may be restricted.

Pricing

Indicative offers a tiered pricing model:

  1. Flexible pricing: Pay for what you use with no overage penalties, including unlimited data inputs, destinations, and data warehouse connections.
  2. Free trial: Enjoy a fully-featured 60-day trial with generous limits, including 1,000,000 events per month and 10,000 monthly tracked users.

Review

Indicative user review

8. Woopra

Woopra

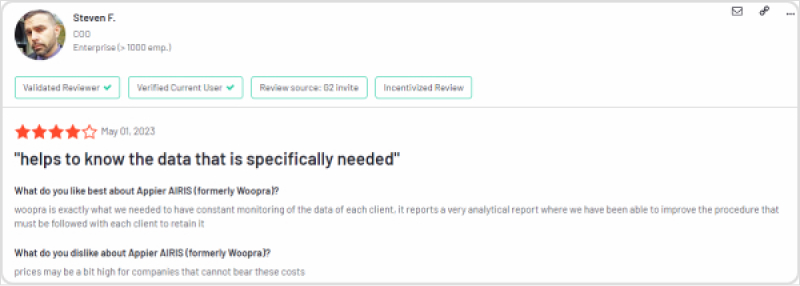
Woopra: Beyond tracking, understanding. See your customer journey unfold in real time.

Woopra is a comprehensive product analytics tool and customer journey analytics platform designed to help businesses understand and optimize the entire customer experience. It offers real-time analytics, extensive user tracking, and powerful segmentation capabilities, enabling organizations to gain deep insights into user behavior and improve their product and marketing strategies.

Features

  • Customer journey analytics: Tracks and visualizes the entire customer journey across different channels and touchpoints.
  • Behavioral analytics: Provides detailed insights into user actions and engagement patterns.
  • Real-time analytics: Offers real-time data and reports for immediate insights and decision-making.
  • Custom dashboards: Custom dashboards are provided to monitor key metrics and KPIs.
  • Integrations: Seamlessly integrates with various third-party tools like CRMs, marketing platforms, help desks, and data warehouses.
  • Automations: Allows automation of tasks and workflows based on user behavior and events.
  • Data enrichment: Enhances user profiles by integrating data from multiple sources for a more complete view.

Here is the table summarizing the pros and cons of Woopra as a product analytics tool:

ProsCons
Real-time dataSetting up automations and integrations can be time-consuming.
Comprehensive user trackingOccasional downtimes or performance issues during peak usage.
User-friendly interfaceAbundance of features can overwhelm new users.
SegmentationHandling and securing sensitive user data adequately.
AutomationsCreating and managing complex automated workflows may require advanced skills.

Pricing

Woopra offers a tiered pricing model:

  • Core (Free): 500K actions/month and 90-day data retention.
  • Pro (Most popular): $999/month, 5 million actions/month, and 2-year data retention. 
  • Enterprise: Contact for pricing.

Review

Woopra user review

9. Pendo

Pendo

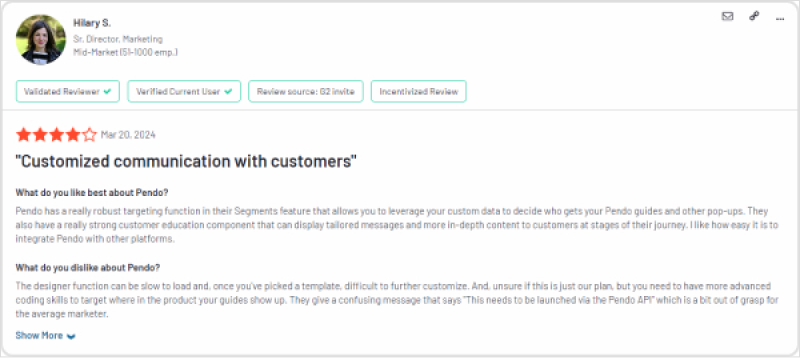
Pendo: Beyond analytics, engagement. Guide your users and delight your customers.

Pendo is a product analytics tool and user experience platform designed to help businesses understand and guide their users through the entire product journey. It offers powerful analytics, in-app messaging, feedback collection, and user guidance tools. Pendo aims to improve user engagement, retention, and satisfaction by providing deep insights into user behavior and facilitating a personalized user experience.

Features

  • Product analytics: Tracks user interactions and behaviors to provide detailed insights into product usage.
  • In-app messaging: Allows for contextual messaging and notifications directly within the app to engage users.
  • User segmentation: Enables user segmentation based on various attributes and behaviors for targeted analysis and messaging.
  • Guided tours: Provides in-app guides and walkthroughs to help users navigate and use the product effectively.
  • Roadmap planning: Facilitates product roadmap planning with user feedback and analytics to prioritize features.
  • Multi-app support: Manages and analyzes multiple applications from a single platform.

Here is the table summarizing the pros and cons of Pendo as a product analytics tool:

ProsCons
Comprehensive user insightsAdvanced customization options can incur additional costs.
In-app engagementIn-app features can sometimes affect app performance and speed.
Customizable dashboardsSome features may overlap, leading to unnecessary complexity.
Strong integrationHeavy reliance on third-party integrations for full functionality.
ScalabilityRegular updates can disrupt usage and require ongoing adjustments.

Pricing

Pendo offers a tiered pricing model:

  1. Free trial: Offered 
  2. Paid plans: Pricing upon request (quote required)

Review

Customized communication and customers

Who uses product analytics tools?

Product analytics tools are used by a wide range of professionals across various industries. The primary users include:

  1. Product managers: They use these tools to track product performance, understand user behavior, and make data-driven decisions about feature development and product roadmaps.
  2. UX/UI designers: Designers leverage product analytics to gain insights into user interactions, identify pain points in the user journey, and optimize the overall user experience.
  3. Marketing teams: Marketers use these tools to analyze user acquisition channels, measure campaign effectiveness, and understand user engagement patterns to refine their strategies.
  4. Data analysts: They dive deep into the data provided by these tools to uncover trends, perform cohort analysis, and generate reports that inform business decisions.
  5. Software developers: Developers use product analytics to monitor technical performance, track errors, and understand how users interact with specific features they’ve built.
  6. Customer success teams: These professionals use analytics to understand user behavior, identify at-risk customers, and proactively address issues to improve retention.
  7. Product owners in agile teams: They use these tools to track sprint goals, feature adoption, and overall product health in an agile development environment.

The use of product analytics tools spans across various industries, including SaaS, e-commerce, finance, healthcare, education, and more. Any business with a digital product or significant online presence can benefit from the insights provided by these tools.

Future trends in product analytics

The field of product analytics is rapidly evolving. Here are some key trends shaping its future:

  1. AI and machine learning integration:
    • Predictive analytics will become more sophisticated, allowing businesses to forecast user behavior and product performance.
    • Anomaly detection will improve, automatically alerting teams to unusual patterns or issues.
    • AI-driven recommendations will help guide product decisions and suggest optimizations.
  2. Increased focus on user behavioral analysis:
    • Tools will offer more advanced capabilities for understanding complex user behaviors and journeys.
    • Sentiment analysis and emotion detection may be incorporated to provide a more holistic view of the user experience.
  3. Advanced visualization and reporting:
    • More sophisticated data visualization techniques will make complex data more accessible to non-technical users.
    • Customizable dashboards and reports will become more flexible and user-friendly.
  4. Cross-platform and omnichannel analytics:
    • As users interact with products across multiple devices and platforms, analytics tools will provide a more unified view of the user journey.
    • This will include better integration of offline and online interaction data.
  5. Voice and natural language interfaces:
    • As voice interfaces become more common, analytics tools will adapt to track and analyze these interactions.
    • Natural language querying of analytics data may become more prevalent, making data more accessible to all team members.
  6. Edge computing for analytics:
    • With the growth of IoT and edge devices, some analytics processing may move closer to the data source for faster insights and reduced data transfer.
  7. Increased focus on product-led growth metrics:
    • Analytics tools will offer more specialized metrics and insights for businesses adopting product-led growth strategies.

These trends indicate a future where product analytics becomes more intelligent, accessible, and integral to business decision-making across all levels of an organization.

Why Usermaven?

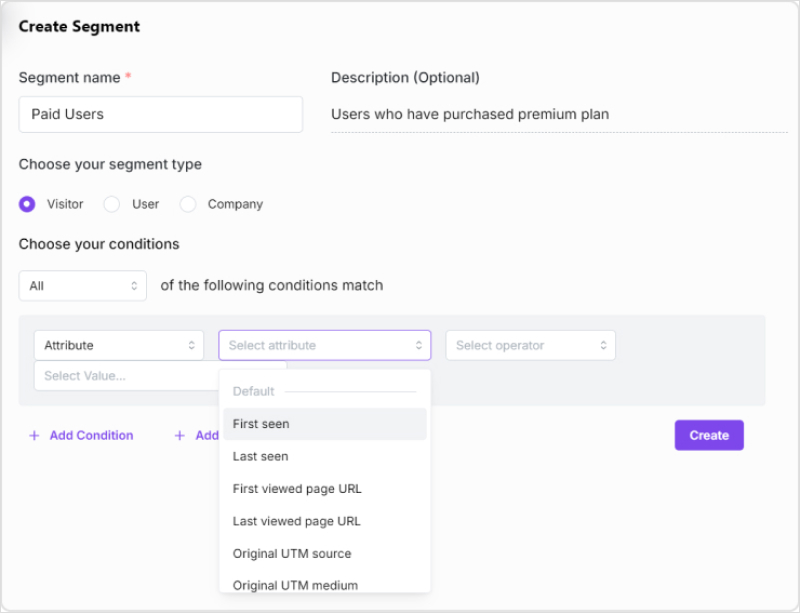
Usermaven is a product analytics tool designed to empower businesses of all sizes with a unique blend of simplicity, privacy, and powerful features:

  • Effortless user experience: Forget the coding headaches! Usermaven boasts a clean and intuitive interface that anyone can navigate, regardless of technical background. This democratizes data analysis, allowing a wider range of users to unlock valuable insights hidden within your data. It’s like having a personal data analyst at your fingertips, minus the hefty price tag.
  • Privacy-centric approach: User data privacy is a growing concern. Usermaven champions a privacy-focused approach, complying with data privacy regulations (like GDPR and CCPA) and ensuring user information is always protected. This builds trust with your users and keeps you on the right side of compliance, allowing you to focus on what matters most – creating a fantastic product.
  • Focus on user-centricity: Usermaven goes beyond basic data collection. It transforms raw data into clear visualizations and actionable insights that put your users at the center. Identify user trends, pinpoint areas for improvement, and ultimately optimize your product for user satisfaction and engagement.

Beyond user-friendliness and privacy!

While the user-friendly interface and privacy focus are game-changers, Usermaven offers additional advantages:

  • Accurate data: Unlike some analytics tools affected by ad blockers, Usermaven provides a clear and accurate picture of user behavior, ensuring you make data-driven decisions based on reliable information.
  • Lightweight script: Unlike tools that can impact website loading speed, Usermaven utilizes a lightweight script, ensuring your website remains performant and delivers a seamless user experience.
  • Comprehensive analytics: Whether you manage a website or a product-based business, Usermaven offers robust features to analyze user behavior across both platforms.
  • Affordable pricing: Usermaven provides transparent and affordable pricing plans that scale with your business needs. Unlike some competitors, Usermaven won’t become a financial burden as your company grows.

End-thoughts

Building a successful product isn’t about guessing—it’s about knowing. 

Product analytics tools give you the insights you need to understand your users and improve their experience. With the right tool, you can make your product something people love. 

Explore the options we’ve covered, choose the best one for your needs, and start making data-driven decisions. Here’s to turning your product into a hit with your users!

Social Media Analytics

Fine-tune your social media strategy for success with in-depth analytics and white-labeled reports.

Get Started for FREE
Social Media Analytics

FAQs

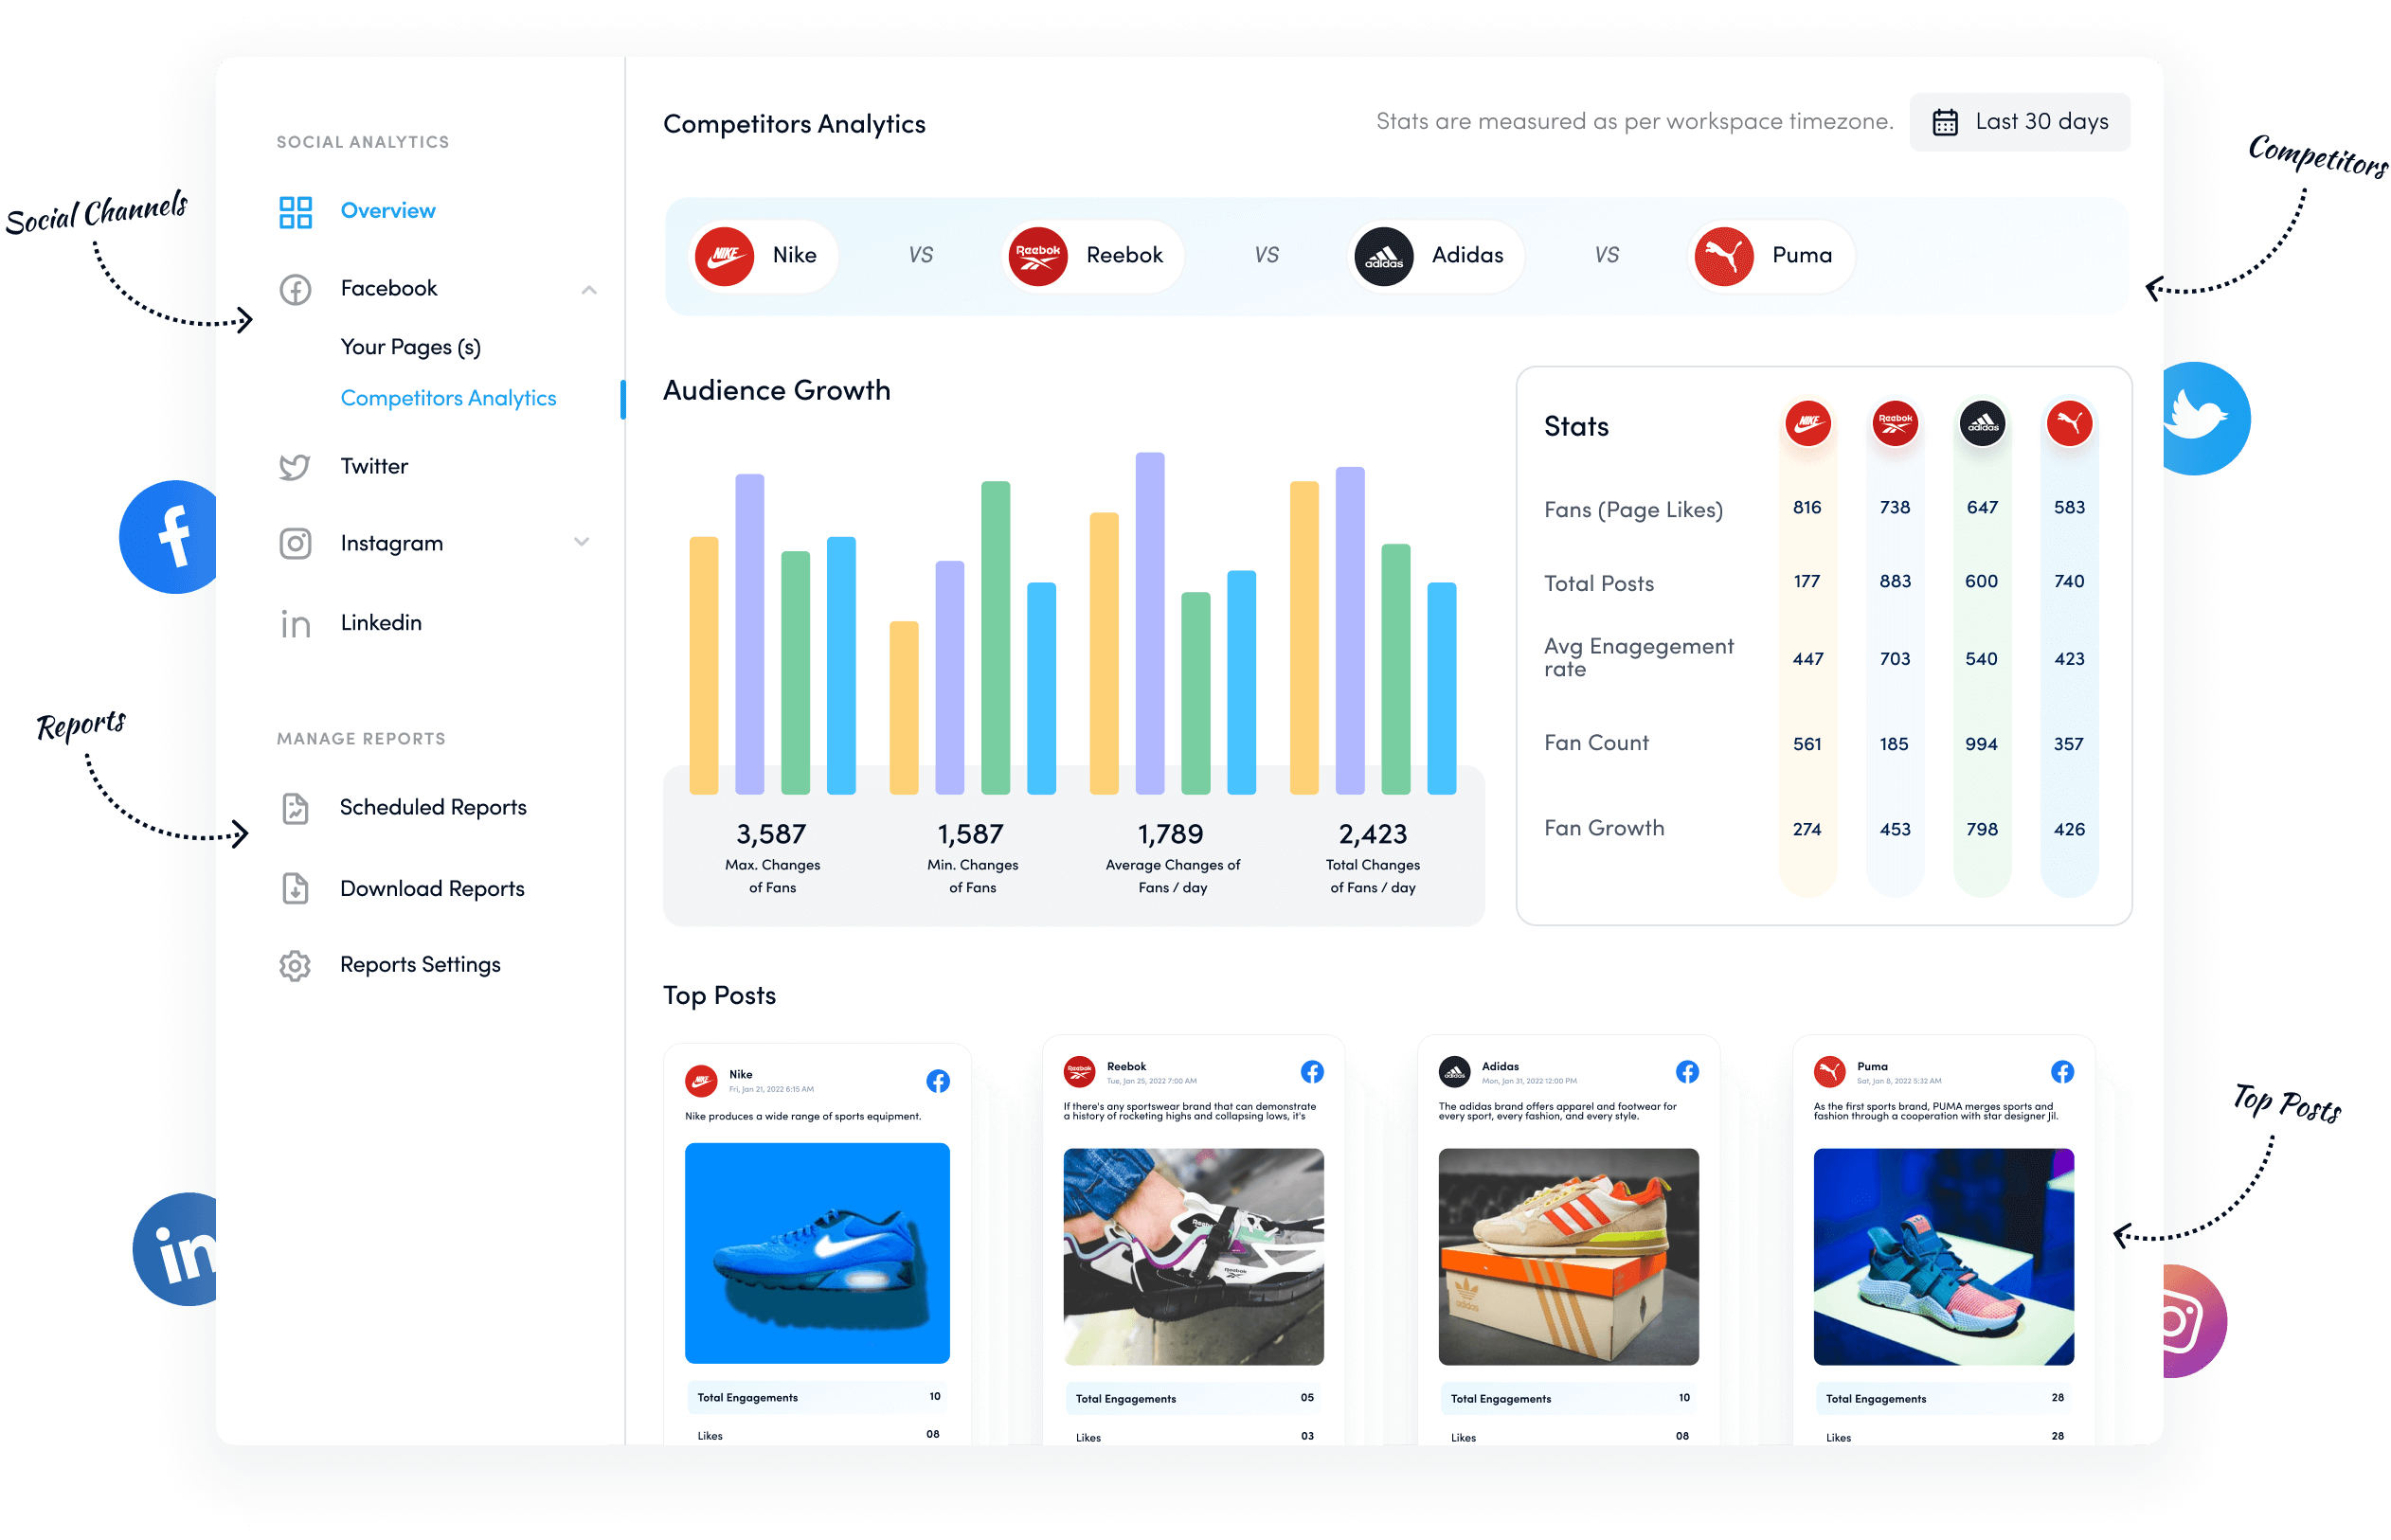
What are product metrics?

Product metrics are quantifiable measures used to track and analyze the performance and usage of a product. They include metrics like user acquisition, engagement, retention, task success, revenue, and user satisfaction. These metrics help teams make data-driven decisions about product development and improvement.

What is the best product analytics tool?

There’s no single “best” platform, as it depends on specific needs and budget. Popular options include Usermaven and certain other tools. The best choice varies based on factors like feature set, ease of use, integration capabilities, and pricing.

How user-friendly are product analytics tools for non-technical users?

Many modern product analytics tools are designed with non-technical users in mind, offering intuitive interfaces, drag-and-drop report builders, and pre-built dashboards. However, the level of user-friendliness can vary between platforms. Some may require more technical knowledge for advanced features.

How do these tools handle data privacy and GDPR compliance?

Most reputable product analytics tools offer features to help with data privacy and GDPR compliance. These typically include data anonymization, consent management, data deletion capabilities, and data storage location options. However, ensuring compliance often requires proper configuration and use of these features.

Can these tools track user engagement across different devices?

Yes, many product analytics tools like Usermaven offer cross-device tracking capabilities. They use various methods like user accounts, device fingerprinting, or statistical modeling to link user activity across different devices, providing a more comprehensive view of the user journey.

When to invest in a product analytics tool?

It’s advisable to invest in a product analytics tool:

  1. When launching a new product
  2. As your user base grows and you need deeper insights
  3. When you’re struggling to understand user behavior or product performance
  4. If you’re looking to make data-driven decisions about product development
  5. When you need to track and improve key metrics like retention or conversion rates

The right time often depends on your product’s maturity, team size, and the complexity of insights needed.

[100% FREE] Unlock Exclusive Social Media Tips & Strategies!

Trusted by 120,000+ agencies, brands, and digital marketing teams. Receive our best content directly in your inbox.

Your email address

Mahnoor Shahid

Mahnoor Shahid

Mahnoor is a pro at writing for B2B and B2C SaaS platforms. She's really good at taking complicated tech talk and turning it into interesting stories. She's helped lots of companies express their brand message in a clear and impactful way.

Recommended for you

Social media management platform
ContentStudio

Powerful social media management software

Entrepreneurs, social media teams, and agencies trust ContentStudio as the optimal yet budget-friendly social media management platform.

    Content planning

    AI writing assistant

    Approval workflow

    Competitor analytics

    Team collaboration

    Automated reports

© 2024 ContentStudio. All rights reserved.

facebook-icon
twitter-icon
instagram-icon
linkedin-icon
youtube-icon
tiktok-icon
App StoreGoogle Play