ContentStudio API plan is now available. Create automations using Claude, Zapier, n8n, make, etc. Explore plan!
Graphical user interface

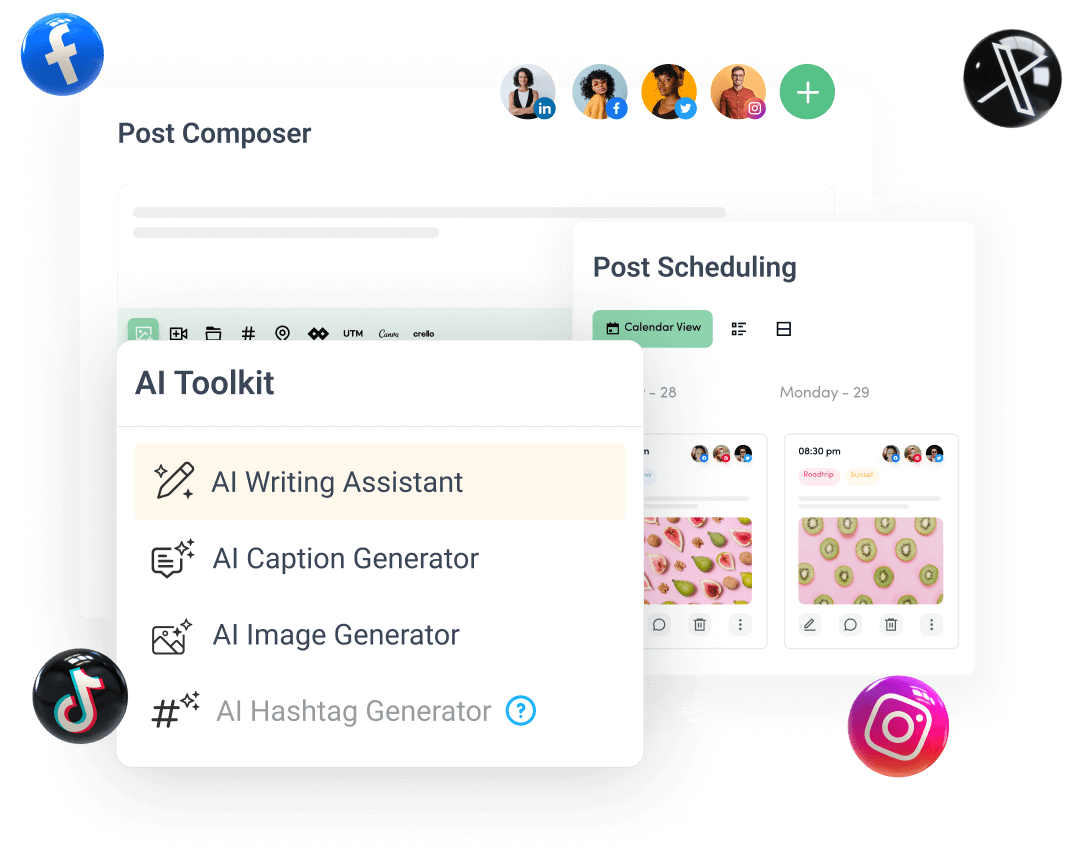
What is a Graphical User Interface (GUI)?
A Graphical User Interface (GUI) is a visual way of interacting with computers and applications through graphical elements instead of text-based commands. In the context of social media management, GUIs transform complex tasks like content scheduling, analytics tracking, and campaign management into intuitive visual experiences that anyone can understand and use effectively.
Core components of a GUI
The fundamental building blocks that make modern interfaces user-friendly and efficient:
Visual elements:
- Icons: Small pictorial representations that instantly communicate function or purpose (like a house icon for "home" or a calendar for scheduling)
- Buttons: Interactive elements that trigger specific actions when clicked, featuring visual feedback to confirm user actions
- Menus: Organized lists of options that expand or collapse to reveal additional choices while maintaining a clean interface
- Windows: Contained areas that can be moved, resized, and arranged to multitask effectively
- Toolbars: Quick-access strips containing frequently used tools and commands for efficient workflow
Interactive features:
- Point-and-click functionality: Direct manipulation of elements that provides immediate visual feedback
- Drag-and-drop capabilities: Natural movement of items between locations, mimicking real-world interactions
- Context menus: Right-click options that change based on what's being clicked, providing relevant tools when needed
- Tooltips: Pop-up help text that appears when hovering over elements, offering instant guidance without cluttering the interface
- Visual feedback: Animations, highlights, and color changes that confirm user actions and system responses
Benefits of GUI in social media management
Modern social media tools leverage GUI elements to transform complex marketing tasks into simple, visual workflows.
Improved productivity
Time-saving features:
- Visual content calendars: See your entire content schedule at a glance with social media calendar
- Drag-and-drop editing: Move content blocks, images, and scheduling slots without complex commands
- Quick-access functions: One-click access to frequently used tools through intuitive icons
- Automated workflow visualization: See your content's journey from creation to publication
- Visual file management: Browse and organize media files using thumbnails and previews
Workflow optimization:
- Task organization: Visual boards showing work progress and team assignments
- Status indicators: Color-coded elements showing content state (draft, review, scheduled, published)
- Team collaboration: Shared interfaces that make group work intuitive using social media collaboration
- Analytics integration: Visual representations of performance data for quick insights
- Approval workflows: Clear visual paths for content review and approval
Enhanced user experience
Accessibility advantages:
- Intuitive learning: Natural interaction patterns that new users can quickly understand
- Visual guidance: Clear cues and indicators that guide users through complex processes
- Consistent interfaces: Familiar patterns and layouts across different tools and sections
- Clear navigation: Visual breadcrumbs and menus that prevent users from getting lost
- Error prevention: Visual warnings and confirmations that help avoid mistakes
Visual organization:
- Logical grouping: Related tools and features clustered together for easy access
- Information hierarchy: Important elements emphasized through size, color, and placement
- Layout structure: Clean, organized interfaces that reduce cognitive load
- Section separation: Clear visual boundaries between different tool areas
- Design patterns: Consistent visual language throughout the interface
GUI design principles in social media tools
Understanding how GUI design principles enhance the usability of content creation and management tools.
User-centered design
Usability focus:
- Navigation systems: Clear pathways through complex features and tools
- Visual hierarchy: Important elements stand out through size, color, and placement
- Interface consistency: Similar functions look and behave the same way across the platform
- Responsive layouts: Interfaces that adapt to different screen sizes and devices
- Accessibility: Color schemes and contrasts that work for all users, including those with visual impairments
Information architecture:
- Content organization: Logical grouping of related features and information
- Menu structures: Intuitive categorization of tools and options
- Workflow patterns: Natural progression through tasks and processes
- Feature grouping: Similar tools placed together for easy discovery
- Priority access: Most-used functions prominently placed for quick access
Visual consistency
Design elements:
- Color schemes: Coordinated palettes that guide users and highlight important elements
- Typography: Consistent font usage that ensures readability and hierarchy
- Icon systems: Unified set of symbols that users can quickly recognize
- Spacing patterns: Consistent layout grid that creates visual harmony
- Visual style: Cohesive design language throughout the platform
Brand integration:
- Color adaptation: Interface colors that match brand guidelines
- Logo placement: Strategic positioning of brand elements
- Theme customization: Ability to align interface appearance with brand identity
- Component styling: Brand-consistent buttons, forms, and interactive elements
- Visual guidelines: Implementation of brand standards across the interface
GUI features in content management
Modern content management systems leverage sophisticated GUI elements to transform complex content operations into intuitive visual workflows. These interfaces make it easier for teams to create, organize, and distribute content across multiple channels while maintaining consistency and quality.
Content creation interface
The visual workspace where content creators bring their ideas to life through intuitive tools and features.
Visual editing tools:
- WYSIWYG editors: Real-time preview editors that show exactly how content will appear when published, eliminating the need to switch between edit and preview modes
- Image manipulation: Built-in tools for cropping, resizing, adding filters, and adjusting image properties with live previews using content creation features
- Video editing: Timeline-based interfaces for trimming clips, adding transitions, and incorporating text overlays without leaving the platform
- Formatting options: Visual controls for text styling, including font selection, color picking, and layout arrangement through intuitive buttons and sliders
- Template systems: Visual galleries of pre-designed content templates that can be previewed and customized with simple point-and-click actions
Media management:
- Visual libraries: Thumbnail-based media browsers that display previews of images, videos, and documents for quick selection using content discovery
- Upload interfaces: Drag-and-drop zones for file uploads with visual progress bars and status indicators
- Gallery organization: Visual tag clouds, folder structures, and filtering options for organizing and finding media assets quickly
- Preview generation: Automatic creation of thumbnails and previews for various content types, including social media post previews
- Asset organization: Visual tools for categorizing, tagging, and managing media files with bulk actions and visual feedback
Content planning features
Visual tools that help teams plan, schedule, and coordinate content delivery across multiple channels.
Calendar visualization:
- Monthly views: Interactive calendars showing content distribution across days and weeks using social media calendar
- Timeline displays: Horizontal timelines showing content flow and gaps in publishing schedules
- Campaign mapping: Visual boards connecting related content pieces and campaign elements
- Event planning: Color-coded event markers and content associations for coordinated publishing
- Schedule management: Drag-and-drop interfaces for adjusting content timing with visual conflict detection
Workflow management:
- Process visualization: Kanban-style boards showing content moving through different stages using social media workflow
- Team coordination: Visual assignment systems with avatar icons and status indicators
- Status tracking: Progress bars and stage indicators showing content development status
- Resource allocation: Visual workload displays showing team capacity and task distribution
- Collaboration tools: Comment threads, annotation tools, and review interfaces tied to specific content pieces
Content optimization tools
Visual interfaces that help improve content quality and performance.
SEO optimization:
- Keyword visualization: Heat maps and highlighting showing keyword distribution in content
- Readability analyzers: Visual indicators of text complexity and readability scores
- Meta data preview: Real-time previews of how content will appear in search results
- Link management: Visual tools for internal and external link tracking
- Performance indicators: Visual scores and suggestions for content optimization
Quality assurance:
- Spell check interfaces: Visual highlighting of spelling and grammar issues
- Brand compliance: Visual alerts for brand guideline violations
- Accessibility checks: Visual indicators of accessibility issues and solutions
- Format validation: Visual confirmation of content meeting platform requirements
- Version control: Visual comparison tools for different content versions
Content distribution interface
Visual tools for managing content publication and distribution across multiple channels.
Publishing tools:
- Channel selection: Visual grid of available publishing platforms with status indicators
- Post preview: Platform-specific previews showing how content will appear on each network
- Scheduling interface: Visual timeline for coordinating posts across different platforms using a social media planner
- Queue management: Visual post queues with drag-and-drop reordering
- Auto-posting setup: Visual configuration of automated posting rules and schedules
Distribution analytics:
- Performance dashboards: Visual displays of content reach and engagement
- Channel comparison: Side-by-side visual comparison of performance across platforms
- Audience insights: Visual breakdown of audience demographics and behavior
- Engagement tracking: Visual heat maps of user interaction with content
- ROI visualization: Graphical representation of content performance metrics
Customization and integration
Visual tools for adapting the content management interface to specific needs.
Interface customization:
- Layout options: Visual grid systems for arranging workspace elements
- Theme selection: Visual preview of different interface themes and colors
- Widget configuration: Drag-and-drop placement of interface components
- Custom views: Save and switch between different interface arrangements
- Accessibility settings: Visual controls for adapting interface accessibility
Platform integration:
- Connection setup: Visual workflow for connecting third-party platforms
- API configuration: Visual interface for managing API connections
- Data mapping: Visual tools for matching data fields between systems
- Sync status: Visual indicators of integration health and synchronization
- Error handling: Visual alerts and troubleshooting guides for integration issues
Mobile content management
Optimized GUI elements for managing content on mobile devices.
Mobile-specific features:
- Touch-optimized controls: Larger buttons and touch targets for mobile interaction
- Simplified workflows: Streamlined processes for mobile content management
- Quick actions: Swipe gestures and quick-access tools for common tasks
- Offline capabilities: Visual indicators of offline status and sync progress
- Mobile preview: Real-time preview of how content appears on mobile devices
Responsive design:
- Adaptive layouts: Interface elements that reorganize for different screen sizes
- Priority functions: Visual emphasis on most-used features on mobile
- Navigation patterns: Touch-friendly navigation systems
- Content scaling: Smart resizing of content and media for mobile viewing
- Performance optimization: Visual indicators of mobile optimization status
GUI in analytics and reporting
The visual representation of data through intuitive interfaces is crucial for making social media analytics accessible and actionable for users of all skill levels.
Data visualization
Modern analytics platforms use various visual elements to present complex data in understandable ways:
Chart types:
- Performance graphs: Transform time-series data into visual trends, showing metrics like engagement rates, follower growth, and post reach over days, weeks, or months
- Comparison charts: Present multiple datasets side by side, such as comparing engagement across different social platforms or content types using content analytics
- Heat maps: Display data density through color intensity, showing peak engagement times or high-activity periods across your social calendar
- Distribution plots: Break down audience demographics through visual charts, helping understand follower age groups, locations, and interests
- Trend visualization: Identify patterns in your social media performance through visual trend lines and pattern highlighting
Dashboard elements:
- Metric cards: Quick-view tiles showing key performance indicators (KPIs) like total engagement, reach, and conversion rates
- Custom layouts: Drag-and-drop dashboard organization allowing users to arrange analytics widgets based on their priorities
- Real-time displays: Live-updating metrics showing immediate performance data for active campaigns and posts
- Comparative views: Side-by-side performance comparisons against goals or previous periods using social media analytics
- Filter controls: Visual elements for refining data views by date range, platform, content type, or campaign
Report generation
Tools and features that transform raw data into shareable insights:
Visual reporting tools:
- Report builders: Intuitive interfaces for selecting metrics, charts, and insights to include in custom reports
- Template systems: Pre-designed report layouts for common reporting needs like weekly performance or campaign analysis
- Data filtering: Visual controls for focusing reports on specific time periods, platforms, or metrics
- Export options: Preview and customize how reports will look in different formats (PDF, PowerPoint, etc.)
- Automation setup: Visual workflows for scheduling regular report generation and distribution
Presentation features:
- Visualization options: Multiple chart types and display options to present data in the most impactful way
- Style customization: Tools for adjusting colors, fonts, and layouts to match brand guidelines
- Annotation tools: Features for highlighting key insights and adding explanatory notes to charts
- Sharing interfaces: Options for distributing reports through various channels with customizable access controls
- Interactive elements: Clickable components allowing report viewers to explore data details
GUI trends and future developments
Emerging technologies and design approaches shaping the future of social media management interfaces:
Emerging GUI technologies
The next generation of interface innovations transforming user interaction:
Advanced interactions:
- Gesture controls: Natural hand movements for navigating interfaces and manipulating content using content management
- Voice integration: Hybrid interfaces combining voice commands with visual feedback for hands-free operation
- AR elements: Augmented reality features overlaying digital information on real-world views
- 3D interfaces: Depth-enhanced interfaces providing more intuitive navigation through content
- Haptic feedback: Physical sensations providing confirmation of actions and interactions
AI integration:
- Smart layouts: Interfaces that automatically organize based on user behavior and preferences
- Predictive elements: UI components that anticipate user needs and prepare relevant tools
- Automated optimization: Self-adjusting interfaces that improve based on usage patterns
- Personal adaptation: Customized experiences reflecting individual user workflows
- Contextual awareness: Interfaces that adapt to user situation and environment
Mobile-first design
Optimizing interfaces for mobile usage while maintaining functionality:
Responsive elements:
- Adaptive layouts: Interfaces that automatically reorganize for different screen sizes and orientations
- Touch optimization: Larger touch targets and gesture-based controls for mobile users
- Mobile navigation: Simplified menu structures optimized for smaller screens
- Content scaling: Smart resizing of content and media for mobile viewing
- Device consistency: Uniform experience across different devices and platforms
Performance optimization:
- Load speed: Fast-loading interface elements prioritizing mobile performance
- Resource efficiency: Optimized memory usage for smoother mobile operation
- Offline capability: Core features that work without constant internet connection
- Battery awareness: Interface design that minimizes power consumption
- Bandwidth optimization: Efficient data usage for mobile users
Best practices for GUI usage
Maximizing the effectiveness of graphical interfaces in social media management:
Interface optimization
Creating efficient workspaces for maximum productivity:
Workspace organization:
- Layout customization: Arranging interface elements to match specific workflow needs
- Shortcut setup: Creating quick-access paths to frequently used features
- Toolbar configuration: Organizing tools based on usage frequency and importance
- View presets: Saving different interface arrangements for various tasks
- Space utilization: Efficient use of screen real estate for optimal productivity
Efficiency techniques:
- Keyboard shortcuts: Quick key combinations for common actions
- Workflow templates: Standardized processes for routine tasks
- Batch operations: Processing multiple items simultaneously
- Automation setup: Reducing manual steps through automated workflows
- Quick access: Minimizing clicks required for frequent tasks
User training and adoption
Supporting effective interface usage across teams:
Learning resources:
- Interactive guides: Step-by-step tutorials walking users through features
- Video tutorials: Visual demonstrations of interface capabilities
- Feature tours: Guided exploration of new interface elements
- Documentation: Comprehensive guides explaining interface components
- Practice scenarios: Hands-on exercises for learning interface functions
Team implementation:
- Onboarding processes: Structured introduction to interface features
- Usage guidelines: Best practices for effective interface interaction
- Training programs: Systematic approach to building interface skills
- Progress monitoring: Tracking team proficiency with interface usage
- Support systems: Resources for resolving interface questions
Common GUI challenges and solutions
Addressing typical issues in social media management interfaces:
Technical issues
Resolving common technical challenges:
Performance problems:
- Interface speed: Optimization techniques for faster response times
- Memory usage: Managing resource consumption for smooth operation
- Cache handling: Efficient management of temporary data
- Update processes: Smooth transitions between interface versions
- Browser issues: Ensuring compatibility across different browsers
Interface glitches:
- Display problems: Solutions for visual rendering issues
- Element alignment: Fixing layout inconsistencies
- Color rendering: Addressing color display problems
- Font display: Resolving text presentation issues
- Animation fixes: Smoothing interface movements
User adaptation
Supporting users through interface changes:
Learning challenges:
- Feature discovery: Tools for finding and understanding interface elements
- Workflow adjustment: Support for adapting to new interface patterns
- Error recovery: Guidance for handling interface mistakes
- Efficiency building: Tips for improving interface speed
- Troubleshooting: Solutions for common interface problems
Workflow transitions:
- Process changes: Support for adapting to new workflows
- Team adoption: Strategies for group interface learning
- Productivity maintenance: Maintaining efficiency during transitions
- Error prevention: Avoiding common interface mistakes
- Progress tracking: Monitoring adaptation success
Create, plan, schedule, and publish posts on all social media networks


