95% of marketers use AI. Only 39% see better performance. The gap isn’t the AI
Oct 7, 20268 minutes

Written by
Hassaan KhanUpdated
![Instagram Reel analytics [Complete guide 2026]](https://internal-blog.contentstudio.io/wp-content/uploads/2024/09/Instagram-reel-analytics.png)
Instagram Reels analytics are performance metrics that show how each video performs across reach, engagement, watch time, and audience retention. You can access them through Instagram Insights on any Business or Creator account, at both the individual Reel level and the account level.
The view count is the first thing creators check. The rest of the data Instagram tracks for every Reel, including reach splits, retention graphs, and skip rates, is where the actual story lives. It usually goes unread.
This guide covers how to access your Reels analytics, what each metric measures, how to interpret the patterns you will find, and how to identify what needs to change.
Instagram Reels analytics are the performance data Instagram collects for every Reel you publish. They show how many unique accounts your video reached, how long viewers watched, how they interacted with it, and whether they followed your account as a result. Instagram tracks this data automatically through its Insights section, which is only available to Business and Creator accounts.
Understanding how Reels work on Instagram gives you useful context for reading the numbers. Reels are built for discovery, so the analytics track performance across both your existing followers and accounts that have never engaged with your profile before. That makes reach behavior very different from what you see with Stories or feed posts.
Analytics are one of the most underused feedback loops in marketing on Instagram. The numbers do not just show you what happened. They tell you why, and what to try differently on the next video.
You need a Business or Creator account to access Instagram Reels analytics. From there, you have two paths: analytics for individual Reels through the Reel itself, and account-level Reels data through the Insights section or your Professional Dashboard.
Reels you post directly or schedule through an Instagram scheduler both appear in Insights with the same full analytics, regardless of how you published them.
To see performance data for a specific Reel, open it from your profile. You have two entry points:
Both routes take you to the same metrics view for that individual Reel.
This gives you aggregated performance across all your Reels over a selected date range. Follow these steps:
You can also access aggregated data through your Professional Dashboard, which appears at the top of your profile. It is useful for a quick summary without navigating the full Insights menu.
The core metrics to track are plays, reach, average watch time, retention rate, skip rate, and interactions. Reading them together gives you a clear picture of how your content is performing and where the weak points are.
Here is what each metric measures and what it tells you:
| Metric | What it measures | What it tells you |
|---|---|---|
| Plays | Total times the Reel was played | Shows raw exposure. High plays with low reach means the same viewers rewatched it |
| Reach | Unique accounts that saw the Reel (split by followers vs. non-followers) | Shows whether your content is finding new audiences or staying within your existing base |
| Average watch time | Average seconds watched per viewer | A low average relative to video length points to a hook or pacing problem |
| Retention rate | Percentage of the video viewers watched on average | A steep early drop-off means the hook is not working; a gradual decline is normal |
| Skip rate | Viewers who scrolled past within the first three seconds | A high skip rate means the opening frame or audio did not stop the scroll |
| Saves | Accounts that saved the Reel to view later | One of the strongest quality signals Instagram weighs. Consistent saves indicate the content is genuinely valuable |
| Shares | Times the Reel was shared to a story, DM, or outside Instagram | High share counts mean viewers found it worth passing along |
| Comments | Number of comments on the Reel | A qualitative signal. Read the comments themselves to understand why people engaged |
| New followers | Followers gained directly from the Reel | Identifies which content is attracting the audience you actually want |
The retention graph deserves specific attention. It shows the exact seconds where viewership drops, which is far more actionable than knowing the average watch time alone. A sharp drop in the first three seconds is a hook problem. A cliff at a specific mid-video point, say the 12-second mark, usually signals a transition or topic shift that lost the viewer.
Reading Reels analytics means looking at the relationship between metrics rather than evaluating each number on its own. High plays paired with a short average watch time tells a very different story than high plays paired with a high save rate.
These are the patterns that give you the clearest diagnostic picture.
If a Reel has low plays but viewers are watching most of it, the content is doing its job but distribution is not. Check when your audience is most active, whether you used relevant or trending audio, and whether the opening frame stands out in the feed.
If the Reel has strong reach but a short average watch time, the problem is the content itself. The opening brought people in but the video did not hold them. The retention graph will show you the exact moment they left.
Views measure visibility. Saves and shares measure resonance. A Reel that consistently generates saves tells you the audience found the content useful or compelling enough to return to. Shares to stories and DMs signal to Instagram’s algorithm that the content is worth distributing further, which directly affects subsequent reach.
Engagement rate, calculated as total interactions divided by reach, is a more reliable performance indicator than view count for any account size. A smaller account with a 15% engagement rate is outperforming a larger account at 2%.
Engagement benchmarks vary significantly based on account size, niche, and content category. Rather than measuring against published industry averages, track the direction of your own numbers across consecutive posts. If average watch time, save rate, and non-follower reach are all moving upward, the strategy is working regardless of the raw totals.
Reel reach fluctuates because Instagram makes distribution decisions in real time based on early engagement signals. Every Reel starts with limited initial reach, and the platform expands distribution based on how the first batch of viewers responds.
A Reel that gets shares, saves, and strong watch-through in the first hour receives broader distribution. One that accumulates skips and short watch times stays within a smaller pool. Identical content posted at different times can perform differently for this reason. The audience composition in that initial window matters.
Instagram’s content ranking algorithm weighs watch time, send-to-story shares, send-to-DM shares, and saves more heavily than likes and comments for Reels distribution. This is different from how the algorithm evaluates feed posts, where broader engagement carries more weight.
Posting consistency also plays a role. Accounts that publish Reels on a regular cadence tend to have more predictable baseline reach because Instagram has more data about what type of audience engages with their content.
According to key Instagram usage statistics for 2026, Reels remain the highest-reach content type on the platform for most account sizes. Instagram actively recommends Reels to non-followers through its recommendation engine. That makes Reel reach more volatile in both directions. A strong Reel can significantly overperform your baseline, and a weak one can fall well short of it.
Native Instagram Insights is the starting point for Reels analytics. It is free, real-time, and covers every metric discussed in this guide. For individual creators and small teams managing a single account, it is sufficient.
Third-party tools add value when you need longer date ranges, multi-account management, or automated reporting. If you are managing client accounts or presenting performance data to a team, native Insights will not scale.
A powerful social media management tool with a reporting layer also makes it easier to track performance trends over time and compare content strategies across multiple accounts, which is difficult to do consistently through native Insights.
When evaluating any analytics tool, look for three things: Reel-specific data breakdowns separate from overall Instagram stats, a date range that goes beyond 30 days, and the ability to sort and filter by individual metrics. Short date ranges make it nearly impossible to spot content patterns.
Analytics should tell you where the problem is before you start adjusting variables. Getting your hashtags for Instagram Reels right is part of the distribution picture, but if your skip rate is high, hashtag strategy will not fix it.
Treating view count as the primary measure of success is the most common mistake creators make. Views measure how many times the video was played, not whether viewers found it valuable, stayed to the end, or took any action. A Reel with high plays and a 10% average watch time is not performing well. It just has enough reach to generate numbers.
Here are the other patterns that lead to misreading the data.
Instagram Stories versus Reels have entirely different distribution mechanics and audience intent. Comparing a Reel’s reach to a Story’s views produces no useful information. Even within Reels, comparing educational content to entertainment content is misleading because the expected engagement patterns are different. Set comparisons within the same content category and format length.
One Reel’s performance is not enough to identify a pattern. A video can underperform because it was posted during a low-engagement window, the audio stopped trending, or the algorithm was in a shift period. None of that reflects the content quality. You need at least 10 to 15 Reels in a consistent format before the data shows patterns you can act on.
The summary metrics view is what most accounts look at. The retention graph gets skipped entirely. The graph is where the diagnostic information lives. It shows the exact second viewers dropped off, which is far more actionable than knowing the average. A sharp drop at a specific moment tells you precisely what to fix in the next video.
Analytics are useful only when checked at consistent intervals. Reviewing a Reel at 24 hours, 72 hours, and one week after posting reveals very different stages of how reach and engagement develop. Checking only at 30 days means missing the early signals that tell you whether to adjust your approach before the next post.
Understanding your Reels analytics does not require tracking every number after every post. It requires knowing which metrics map to which problems. Low reach is a distribution issue. Low average watch time is a content or hook issue. Low engagement rate relative to reach is a relevance issue.
The most useful habit to build is consistent tracking. Check your analytics at the same intervals after posting, compare within the same content categories, and give yourself enough posts before drawing conclusions. Patterns become visible quickly once you have a reference point.
Yes, Instagram Reels analytics are available through Insights on Business and Creator accounts. They include plays, reach, watch time, skip rate, retention, and interactions for every Reel you publish.
Open the Reel on your profile and tap the three dots or the insights text at the bottom, then select View insights. For account-level data, tap the hamburger icon on your profile, go to Insights, select Content you’ve shared, and tap Reels.
Watch time benchmarks vary by video length and niche. A more useful signal is whether your average watch time is improving across consecutive posts in the same format. A steep drop-off in the first three seconds is the pattern worth addressing first.
Low views usually come from one of three causes: an early engagement signal that did not trigger wider distribution, a posting time that missed your audience’s active window, or a hook that is not stopping the scroll. Check your skip rate and the first few seconds of the retention graph before making other changes.
Yes. Instagram’s Insights section is accessible through the web app on desktop. Go to your profile, select Insights, and the Reel-specific data is available there, including the metrics breakdown for individual videos.
Plan 0 Days of Content in 0 Minutes
Create, schedule, publish and analyze your content across all your social media channels from one simple dashboard.
4.7 on Capterra • 16,500+ marketers trust ContentStudio
Hassaan Khan is a Senior Contributing Writer and Editor at ContentStudio and a writer for SaaS and e-commerce brands, with bylines at SEMrush, ThriveGlobal, and BloggingCage. He covers social media marketing, technical SEO, and analytics, from Instagram impressions to hashtag analytics, and reviews articles for technical accuracy and SEO soundness.
View all posts by Hassaan KhanRecommended for you
95% of marketers use AI. Only 39% see better performance. The gap isn’t the AI

How to run a holiday campaign calendar from chat with OpenClaw
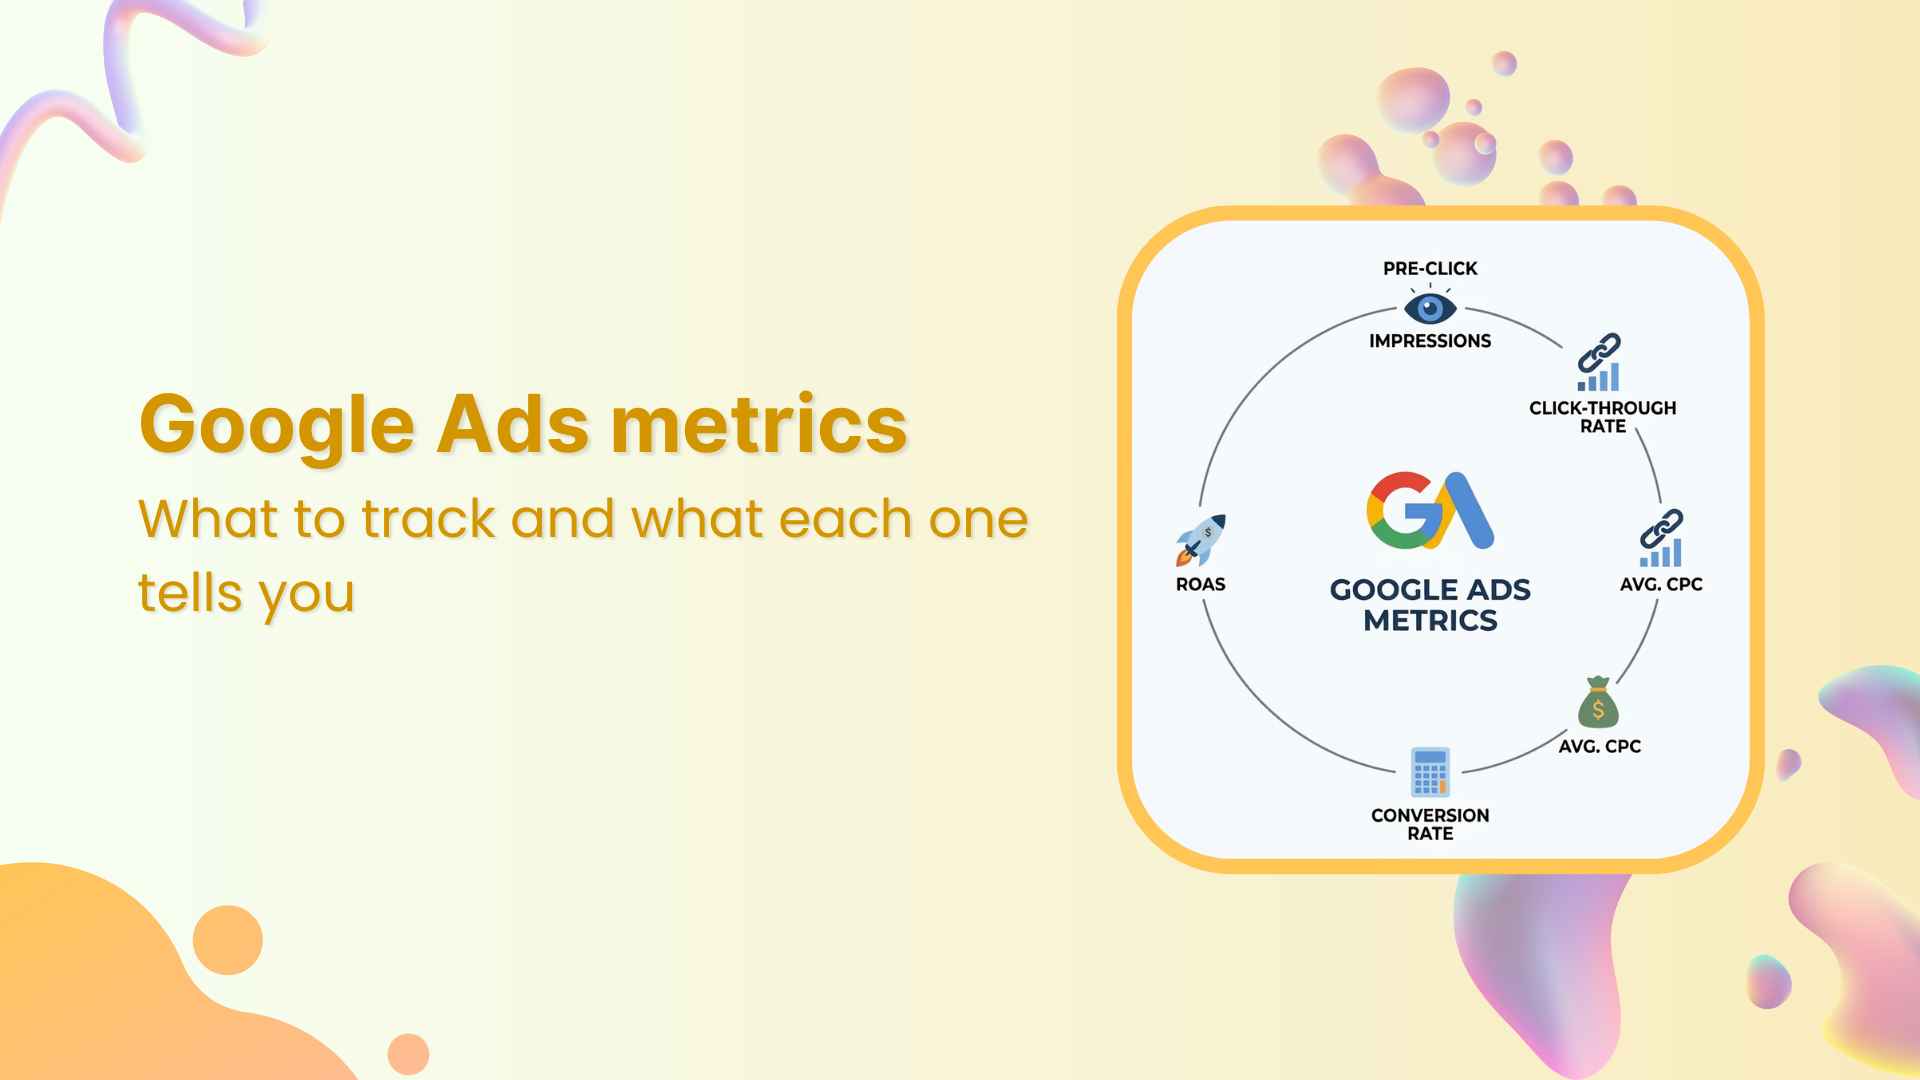
Google Ads metrics: What to track and what each one tells you

10 social media goals for marketers