
How to promote affiliate links on social media in 2026
Oct 2, 202616 minutes

Written by
Esha ShabbirUpdated
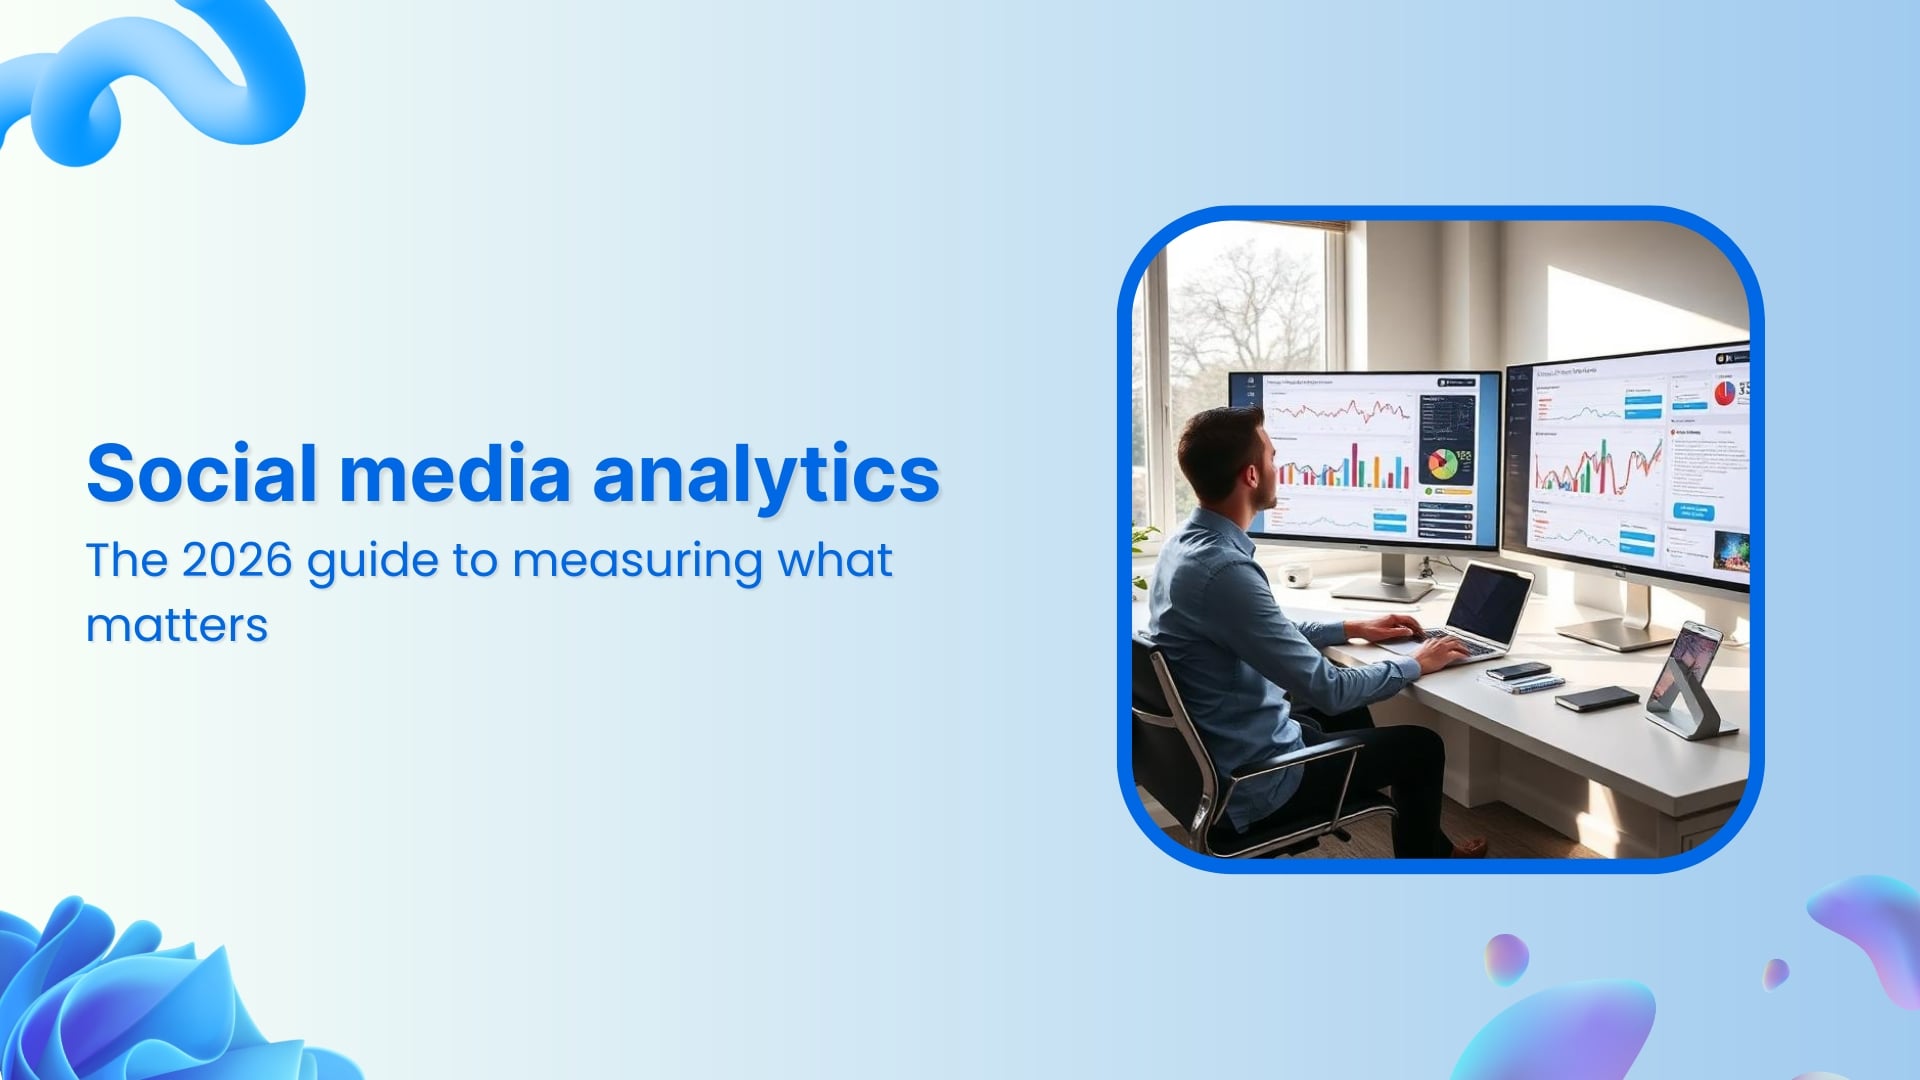
Social media analytics is how you collect and interpret data from your social channels to understand what is working, who your audience is, and whether your efforts are producing real business outcomes. Every platform gives you a dashboard, but knowing which numbers to act on is a different skill entirely.
Teams that get real value from analytics bring everything into a single social media analytics platform rather than five separate dashboards. Cross-channel performance, competitor benchmarks, and audience data together is where the patterns become visible.
This guide walks through the full framework. It covers which metrics matter and when, how signals differ by platform, how to set KPIs, build a reporting cadence, and act on what the data tells you.
Social media analytics tells you what your content is producing, who your audience actually is, how you compare to competitors, and whether your paid campaigns are spending efficiently. It is the measurement layer that sits across everything you do on social.
It covers five distinct areas of your social presence.
Analytics and social media monitoring are often grouped but they measure different things. Analytics covers your own content performance and the audience that engages with it. Monitoring tracks brand mentions and conversations that happen independently of your posts.
Every major platform provides free native analytics. Meta Business Suite covers Facebook and Instagram, and LinkedIn, TikTok, YouTube, and X each have their own dashboards. These are accurate but siloed to one channel at a time. Teams managing multiple channels typically consolidate everything into a third-party tool for a unified view.
Social media analytics matters because it is the only reliable way to connect social activity to real outcomes. Without it, decisions about what content to create, when to post, and where to invest time or budget rest on assumption. Analytics replaces assumption with evidence.
Here is what changes when you read the data properly.
The main types are performance analysis, audience analytics, competitive analysis, sentiment analysis, and paid social analytics. Each answers a distinct question about how your social presence is performing. Combining them gives you a picture that no single type can provide on its own.

Performance analysis tracks how your content does after it goes live: reach, impressions, engagement, video views, clicks, and completion rates. It is the most commonly used type because it gives immediate feedback on what you published.
The goal of performance analysis is pattern recognition, not spotting individual wins. Pulling your top 20 and bottom 20 posts by engagement rate every quarter gives you more usable content intelligence than checking daily post stats. You are looking for the consistent characteristics of content that works: format, hook style, topic, posting time, caption length.
Audience analytics focuses on who engages with your content and how that profile changes over time. It covers demographics (age, gender, location, language), interests, activity times, and follower growth and churn patterns over time.
The most useful signal from audience analytics is whether the people engaging with your content actually match your target customer. Tracking audience engagement patterns over time surfaces drift before it compounds. If your Instagram audience has shifted from your target demographic to a group outside it, that is not visible from impressions or follower count. It shows up in audience analytics.
Competitive analysis benchmarks your social performance against competitors or industry standards. It tracks how frequently competitors post, which formats they favor, their engagement rates, follower growth trends, and how their campaigns land relative to yours.
Mapping your competitor’s social presence regularly reveals where they are winning attention and where they are leaving gaps, including topics they are not covering, formats they have abandoned, and audiences they are losing. That is the external reference point your own performance data cannot provide.
Sentiment analysis interprets the emotional tone of how people discuss your brand online. It classifies mentions, comments, and conversations as positive, negative, or neutral and groups them by theme, showing whether customer complaints cluster around a specific product, campaign, or customer service issue.
A sentiment drop that does not correspond to any content you published is a signal about brand perception that will not surface in any engagement or reach metric. It is one of the most underused analytics types because it requires tooling beyond native dashboards.
Paid social analytics tracks the performance of your ads and boosted content. The core metrics here are cost per click, click-through rate, cost per result (lead, signup, or purchase), and return on ad spend.
This analytics type sits at the intersection of creative decisions and media buying decisions. A high cost per result on a specific ad is a signal about either audience targeting or creative quality. The analytics tells you which variable to investigate. Without it, you are cutting spend based on a hunch.
The metrics that matter depend entirely on your goal. Reach is not more important than engagement rate. Engagement rate is not more important than UTM-tracked leads. What is important is whether the metric you are tracking connects to a decision you are making. The framework below maps metric categories to specific goals so you are tracking what is relevant, not everything that is available.

The most common analytics mistake is tracking every number a platform surfaces and including all of it in weekly reports. A report full of metrics that no one acts on is not analytics. It is filing.
Awareness metrics tell you how many people your content is reaching. They are the right primary metrics when your goal is visibility, covering situations like a new market entry, a product launch, or building recognition with an audience that does not yet know you.
The table below covers the main awareness metrics and what each one measures.
| Metric | What it measures | When it matters most |
| Impressions | Total times your content appeared in feeds, including multiple views by the same person | Assessing content distribution volume |
| Reach | Number of unique accounts that saw your content | Measuring unduplicated audience exposure |
| Share of voice | Your brand’s percentage of total category mentions compared to competitors | Competitive brand positioning |
| Follower growth rate | Percentage change in audience size over a defined period | Audience-building campaigns |
| Video views | Number of times video content was played (minimum threshold definitions vary by platform) | Video-first content strategies |
The distinction between reach and impressions matters more than it looks. Understanding how reach and impressions differ tells you whether your content is reaching new viewers or cycling through the same audience repeatedly. A post with 15,000 impressions and 2,500 reach means the average viewer encountered it six times, a distribution story that changes how you interpret the numbers entirely.
What social media reach actually measures, including reach rate, viral reach, and how organic reach differs from paid reach, is worth clarifying before you build any reporting framework that includes awareness metrics as a KPI.
Engagement metrics show how your audience responds to your content. They require the viewer to take an action, which makes them a more meaningful signal than impressions.
| Metric | What it measures | Notable platform context |
| Engagement rate | Total engagements divided by reach or followers, expressed as a percentage | Universal (the standard benchmark for cross-account comparison) |
| Saves | Content bookmarked for later viewing | Instagram and TikTok weight saves heavily in organic distribution |
| Shares and retweets | Content redistributed by the viewer | X, LinkedIn, and Facebook |
| Comments | Text responses to content | Universal |
| Link clicks | Traffic generated from a post to a linked URL | Universal |
| Reactions | Platform-specific emotional responses | Facebook and LinkedIn have expanded reaction sets |
Engagement rate normalizes for audience size, which makes it the standard benchmark for comparing performance across accounts of different scales. A 3% rate on LinkedIn and a 3% rate on TikTok are not equivalent achievements. What drives engagement on social differs by platform, and so does what that number actually means.
Saves also signal something different from comments, and the engagement metrics that matter are not always the ones that feel most prominent in a dashboard.
Conversion metrics connect social activity to actions that have direct business value: website visits, lead form completions, signups, and purchases.
| Metric | What it measures |
| UTM-tracked sessions | Website traffic attributed to specific social posts or campaigns |
| Social-attributed leads | Form completions or signups that originated from a social touchpoint |
| Social CTR | Percentage of content viewers who clicked a link in your post |
| Cost per lead (paid social) | Total ad spend divided by leads generated through paid social |
| Social-attributed revenue | Sales traced back to a social channel through UTM or attribution modelling |
None of these are trackable without UTM parameters on every link you share. Without UTMs, your analytics platform cannot separate a visitor who arrived from your LinkedIn post from one who came through email or a Google search. UTM hygiene is not optional if any form of ROI measurement is a requirement.
Brand health metrics track how your brand is perceived across social channels, beyond what you publish.
| Metric | What it measures |
| Sentiment score | Ratio of positive to negative brand mentions over a defined period |
| Share of voice | Your percentage of total category conversation compared to competitors |
| Mention volume | Total times your brand appears in social conversation |
| Response rate and time | How quickly and consistently you reply to audience messages |
Understanding how to measure brand awareness accurately requires combining your own content’s reach data with share of voice data from broader social listening. Follower count alone is a poor proxy. A brand with 40,000 followers in a category where competitors have 400,000 has very different awareness levels, and those only become visible when the metrics are read together.
The right social media metrics are determined by your business goals, not by what platforms surface by default. Not all of them belong in your reports.
Each platform weights different behaviors in its algorithm and surfaces different data in its native analytics. Instagram prioritizes saves and shares over likes. LinkedIn provides professional demographic data no other platform can match. TikTok centers on watch time and completion rate. YouTube provides a measurable funnel from impression through to conversion.
Applying the same reporting framework across all platforms without adjusting for these differences produces misleading comparisons.
Instagram’s algorithm currently weights saves and shares more heavily than likes. A post with 400 saves and 150 likes signals stronger content quality than one with 3,000 likes and no saves. This is a significant shift from how the platform worked several years ago and changes which metrics deserve priority in reporting.
Key metrics to track on Instagram:
Tracking hashtag performance data at the post level tells you which tag sets are actually driving discovery versus adding noise. Instagram’s native analytics shows hashtag reach per post, a direct indicator of which tags are contributing to distribution and which can be retired.
LinkedIn surfaces professional demographic data that no other major platform provides: who viewed your content by job title, seniority level, industry, and company size. For B2B measurement, this makes LinkedIn’s analytics uniquely valuable even when engagement rates are lower than on other platforms.
Key metrics to track on LinkedIn:
LinkedIn’s algorithm currently favors content that keeps users on the platform rather than sending them elsewhere. This is consistently reflected in the analytics: posts with no external links regularly outperform link posts in reach. Your own data will confirm or challenge this for your specific audience, but the pattern is broad.
TikTok’s primary ranking signal is watch time and video completion rate. A video with strong early completion gets distributed to progressively larger audiences. A video with strong likes but poor completion does not, regardless of its engagement count.
Key metrics to track on TikTok:
TikTok Search has become a significant content discovery channel, particularly for how-to and educational content. Videos that perform well in TikTok search results have different characteristics from those built for the For You Page. Your analytics will tell you which distribution channel is actually driving views and follows. Treating TikTok purely as a short-form video feed ignores a meaningful traffic source.
X analytics center on impressions, engagements, and link clicks. The platform weights replies and quote posts as stronger engagement signals than passive likes. A reply indicates a deeper audience response, and that difference is reflected in how the algorithm treats content.
Key metrics to track on X:
API access for third-party analytics tools on X has changed significantly over the past two years. If you use a third-party tool for X reporting, confirm it still has access to the specific metrics it displays. Data gaps on X are more common now than on other platforms.
Facebook’s algorithm heavily weights comments and shares over likes. Reach for link posts has declined for most Pages over recent years, while Reels have seen significantly higher organic distribution. That shift is visible in the analytics when you break down reach by content type. It rarely requires interpretation once you see the numbers side by side.
Key metrics to track on Facebook:
Facebook’s native analytics in Meta Business Suite provides solid page-level data but has limited visibility into how content spreads through private shares. A reach spike that does not correspond to any paid promotion is often driven by secondary sharing, which the primary analytics view does not fully surface.
YouTube is simultaneously a social platform and the world’s second-largest search engine, which makes its analytics the most complex of the major channels. The full funnel from impression to click to watch time to subscription to conversion is measurable at every stage, and each stage has a distinct optimization implication.
Key metrics to track on YouTube:
The audience retention graph is the most directly actionable metric YouTube provides. It shows the exact timestamps where viewers stop watching, which gives you a specific target for improvement, whether that is your hook, your pacing, an information-dense section, or your call to action placement. Other metrics tell you how videos perform. The retention graph tells you why.
Meaningful social media KPI connects a specific metric to a specific business goal, with a defined baseline and a target. Linking your social media KPIs to business goals is a process many teams skip. Without it, any target is arbitrary, and the reporting it generates cannot tell you whether social is actually working.

Here is the core process for setting KPIs that actually hold up to scrutiny.
Here is an example KPI mapping by business goal:
| Business goal | Primary KPI | Secondary KPI | Supporting metric to watch |
| Brand awareness | Monthly reach growth rate (%) | Share of voice vs. top 3 competitors | Follower growth rate |
| Website traffic | UTM-tracked social sessions per month | Social CTR per post type | Bounce rate from social sources |
| Lead generation | Social-attributed form submissions | Cost per lead (paid social) | Lead-to-close rate from social |
| Community building | Average engagement rate | Saves and shares per post | Comment rate per post type |
| Brand reputation | Positive sentiment ratio | Mention response rate | Share of voice trend quarter-over-quarter |
| Recruitment | LinkedIn company page impressions | Career content engagement rate | Follower growth from target job titles |
A social media reporting process structures your analytics into cadences tailored to different audiences. Your social team needs a weekly post-level view. Marketing leaders or clients need a monthly KPI summary with a clear takeaway. Executives need a quarterly narrative that connects social performance to business outcomes in financial terms.
A reporting process answers three questions: what happened, why it happened, and what you are doing about it. Reports that only answer the first question are data summaries. Reports that answer all three are management tools that drive actual decisions.
The weekly review, monthly summary, and quarterly narrative each have a distinct structure and purpose.
Social team weekly review:
Marketing leader or client monthly report:
Executive or board quarterly report:
The cadence determines how quickly your team can respond to what the data is telling them. A consistent cadence turns analytics from a reactive habit into a forward-looking one.
| Cadence | Purpose | Primary audience |
| Daily | Catch sudden spikes, emerging issues, or campaign anomalies early | Social media manager |
| Weekly | Short-term trend tracking, content calendar decisions | Social team, account manager |
| Monthly | KPI progress review, campaign analysis, optimization decisions | Marketing leader, client |
| Quarterly | Strategic review, budget justification, goal-setting for next period | CMO, leadership, board |
Native platform dashboards are accurate and free for single-channel reporting. The limitation is that you are compiling data manually across platforms with no cross-channel comparison in a single view.
A social media management tool that includes analytics removes that overhead, giving you cross-channel data in one place, automated scheduled reports, white-label output for clients, and competitive benchmarks alongside your own performance data. Which tool fits depends on how many channels you manage, whether you need client reporting, and what your budget allows. Evaluating the top social analytics tools before committing to one is worth the time.
Acting on analytics means using data to change specific decisions, including which formats to prioritize, which topics to drop, which channels get more investment, and which creative approaches to test next. If your monthly analytics review does not result in at least one concrete change, you are producing reports rather than improving performance.

A single viral post does not prove your strategy is working. One underperforming post does not prove it is broken. What matters is consistency: formats that reliably outperform others, topics that consistently attract shares, times that regularly produce above-average reach.
Run a quarterly review of your top 20 and bottom 20 posts by engagement rate. List the common characteristics of each group, covering format, topic structure, hook style, caption length, posting time, and use of hashtags. Those patterns are your actual content intelligence. The outliers in either direction are noise, and treating them as signals produces chaotic content decisions.
When analytics show a specific metric underperforming, change one variable and hold everything else constant for four weeks. If LinkedIn engagement is below your benchmark, test the hook first. If that does not move the needle, test the format. If that does not move it, test the posting time.
Changing multiple variables at once is faster in the short term and useless for learning. You improve a metric and have no idea which change was responsible, so you cannot repeat it. Four-week, single-variable testing is slower and produces information you can build on.
Analytics tells you where the gap is. Closing it requires specific adjustments. If your engagement rate is below benchmark, the issue might be in how your posts end, specifically whether they invite a specific response versus close with a passive observation that gives the reader no reason to comment.
Once you know which gap you are trying to close, the social media engagement hacks that work depend on the platform and format you are dealing with.
Your historical data tells you whether you are improving. It does not tell you whether you are competitive. Monitoring your competitors’ social presence every quarter gives you the external reference point that internal metrics alone cannot provide. It also surfaces where competitors are declining, areas where audience attention is becoming available, and where you have an opportunity to move in.
Social media ROI is measured by connecting social activity to financial outcomes through UTM tracking, defined conversion goals, and CRM attribution.
The three most practical calculations are traffic value (social sessions multiplied by the equivalent paid search cost-per-click), lead value (social-attributed leads multiplied by deal size and close rate), and paid social ROAS (revenue attributed to ads divided by ad spend).
Three things need to be in place before any ROI calculation is reliable.
The right approach depends on how directly you can tie social activity to revenue.
Proving the ROI of social media to a skeptical leadership team requires more than one number. Social ROI rarely lives in isolation. Most finance and marketing leaders want to see it alongside broader marketing ROI data, and your attribution setup needs to reflect that.
Social media analytics data is reliable but imperfect. Platform API restrictions, bot activity, attribution gaps, and dark social sharing all affect the accuracy of the numbers you report. Understanding where the data gets unreliable helps you report more honestly, investigate anomalies correctly, and set realistic expectations with stakeholders.
Every major platform controls what data third-party tools can access. Facebook and Instagram have restricted API access significantly over the past several years. This means some third-party analytics tools may be working with incomplete data for specific metrics. When a finding in a third-party tool conflicts materially with what you see in the native dashboard, the native dashboard is generally the more reliable source.
Engagement numbers can be artificially inflated by bot accounts, particularly on platforms where follower growth schemes are active. A sudden engagement spike that does not correspond to any change in content, posting schedule, or audience profile is a signal worth investigating. Running a periodic audit of fake followers keeps your baseline data clean and your performance benchmarks reliable.
Social media is rarely the last touchpoint before a conversion in B2B contexts. A prospect might see your LinkedIn post, follow your account for three months, then convert through a direct Google search or via email. Last-click attribution will not credit social for that conversion. A multi-touch attribution model gives a more accurate picture but requires more sophisticated setup and clear agreement on attribution windows before the tracking goes in.
A significant portion of content sharing happens through private channels, including direct messages, WhatsApp, Slack, and email, that appear in website analytics as direct traffic and are invisible in social platform analytics. This “dark social” traffic is an inherent gap in the current measurement infrastructure. UTM parameters do not fully solve it. Accounting for it means acknowledging that your social analytics likely undercounts the true reach of content that resonates enough to be shared privately.
Social media analytics is only as useful as the decisions it produces. Having the right tool and the right cadence means nothing if the numbers never actually change what you publish.
The teams that get the most out of their data are not tracking more. They are watching fewer things more carefully and acting on what those numbers tell them before the next cycle starts.
That is what separates analytics as a practice from analytics as a reporting obligation. One improves your results. The other just documents them.
Social media analytics is the process of collecting and interpreting data from your social channels to understand how your content performs, who your audience is, and whether your efforts are producing real business outcomes. It covers everything from post-level engagement to brand sentiment, competitive benchmarks, and social-attributed revenue
The main types are performance analysis, audience analytics, competitive analysis, sentiment analysis, and paid social analytics. Together, they cover how your content performs, who your audience is, how you compare to competitors, how your brand is perceived, and how efficiently your ads are spending.
Track metrics that connect directly to your goal. For awareness, track reach and impressions. For engagement, track engagement rate and saves. For conversions, track UTM-attributed sessions and social-attributed leads or revenue.
The starting point is each platform’s native dashboard. For a unified view across channels, use a social media management platform that consolidates data from all connected accounts into one place automatically.
Benchmarks vary by platform, industry, and audience size. On Instagram, 1 to 3% is generally solid for accounts over 10,000 followers. Always compare against your specific industry category rather than platform-wide averages, which flatten real variation.
Analytics measures the performance of your own published content and audience. Social media monitoring tracks what people say about your brand across the web, including conversations you are not part of.
A metric is any measurable data point. A KPI is a metric tied to a specific business goal with a defined baseline and target. The difference is whether the number is attached to a decision and a clear accountability structure.
Social teams should review post-level performance weekly, marketing leaders monthly, and executives quarterly. Daily checks help catch sudden spikes or emerging issues, but strategic decisions need longer trend windows to be reliable.
Start with UTM parameters on every shared link so you can attribute website traffic, leads, and conversions to specific social activity. From there, calculate traffic value, lead value, and paid social ROAS to connect social output to business outcomes.
Plan 0 Days of Content in 0 Minutes
Create, schedule, publish and analyze your content across all your social media channels from one simple dashboard.
4.7 on Capterra • 16,500+ marketers trust ContentStudio
Esha Shabbir is a content marketer at ContentStudio, specializing in social media strategy, SEO-led content, and editorial workflows for marketing teams. She writes practical, research-backed content that helps marketers understand what to publish, how to organize their content, and how to build a more consistent social media presence.
View all posts by Esha ShabbirRecommended for you
How to promote affiliate links on social media in 2026

Multi-location social media management workflow guide
Best SaaS affiliate programs for social media marketers in 2026

19 best social media management tools to plan, schedule, and grow in 2026