Black Friday vs. Cyber Monday: The real difference for software buyers
Oct 22, 202614 minutes

Written by
Wasiq NaeemUpdated
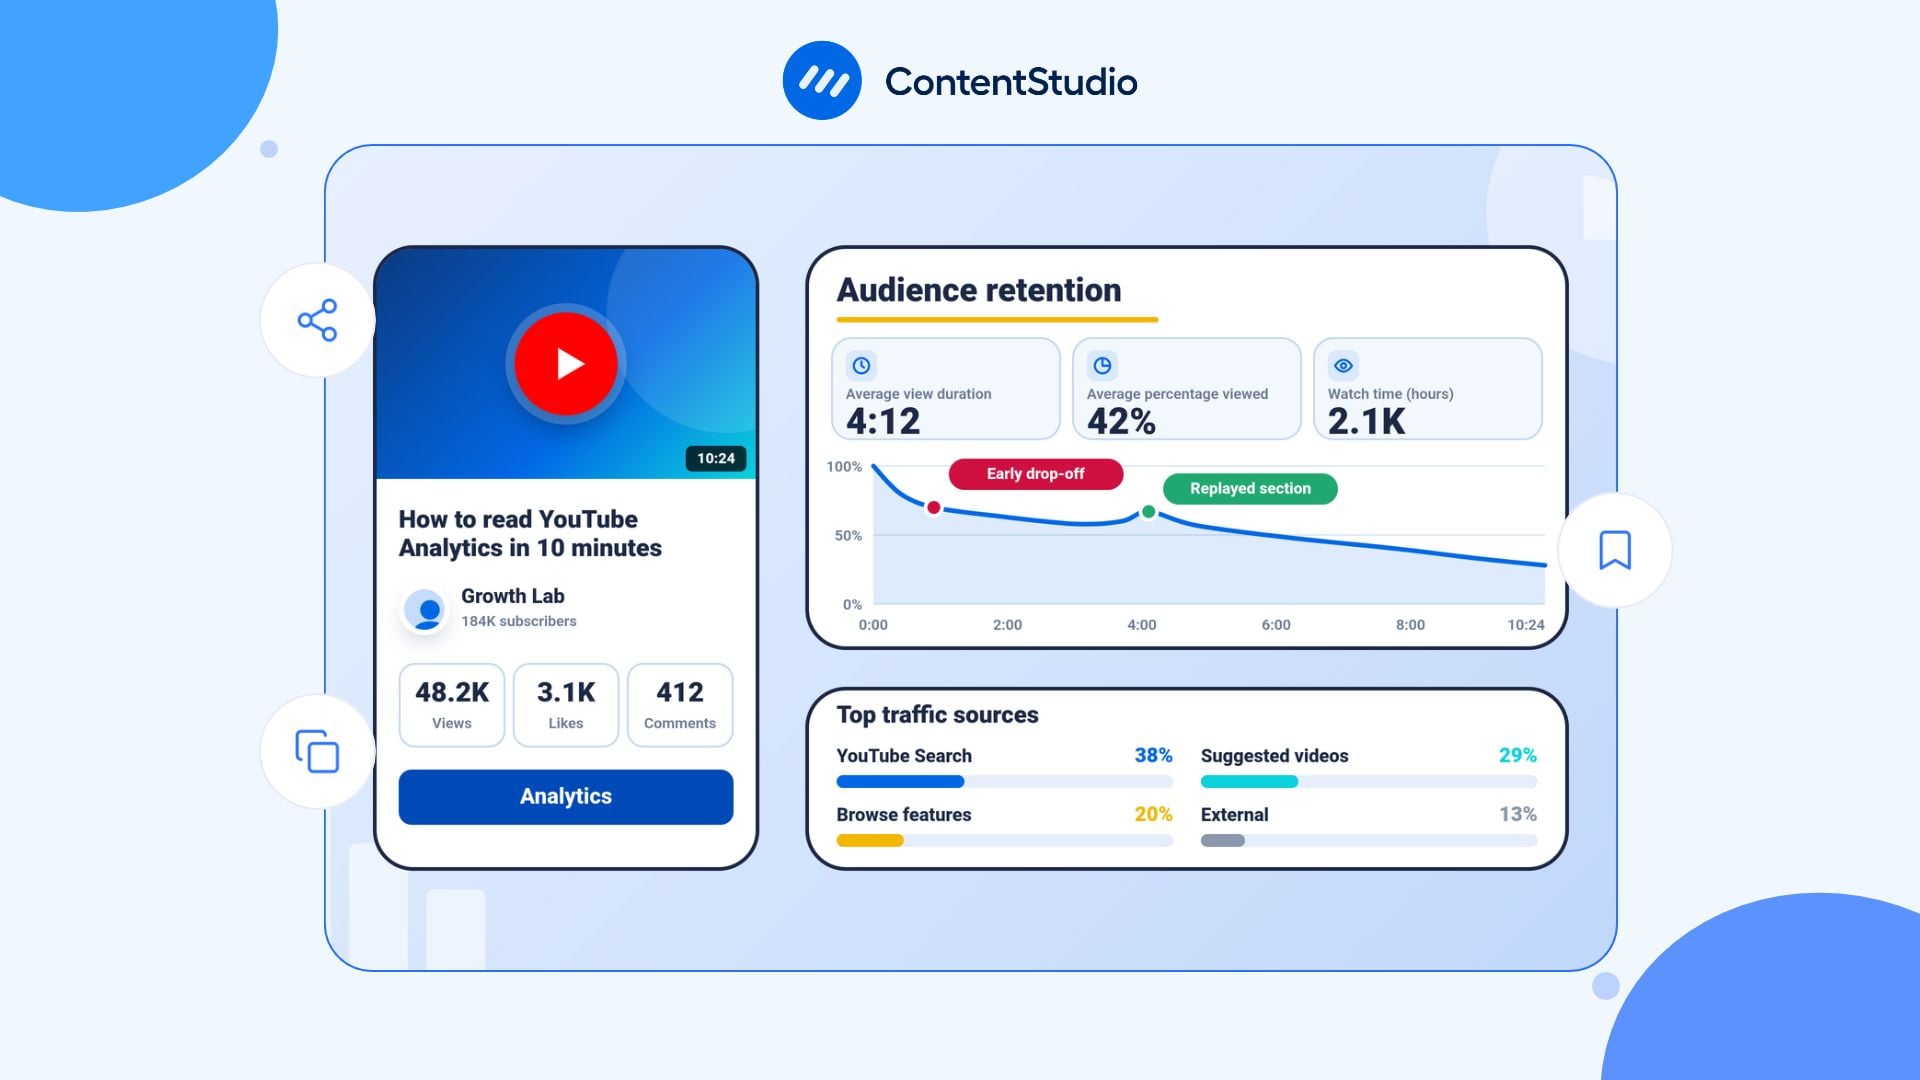
A YouTube video can rack up thousands of views and still fail to grow your channel. The real question is what happens after someone clicks: Do they keep watching, subscribe, return for another video, or leave within seconds? YouTube Analytics helps you uncover those answers so you can stop guessing and start making smarter content decisions that support long-term YouTube channel growth.
YouTube Analytics is YouTube Studio’s built-in reporting tool for videos, Shorts, and live streams. It helps creators, marketers, and businesses measure content performance and understand viewer behavior.
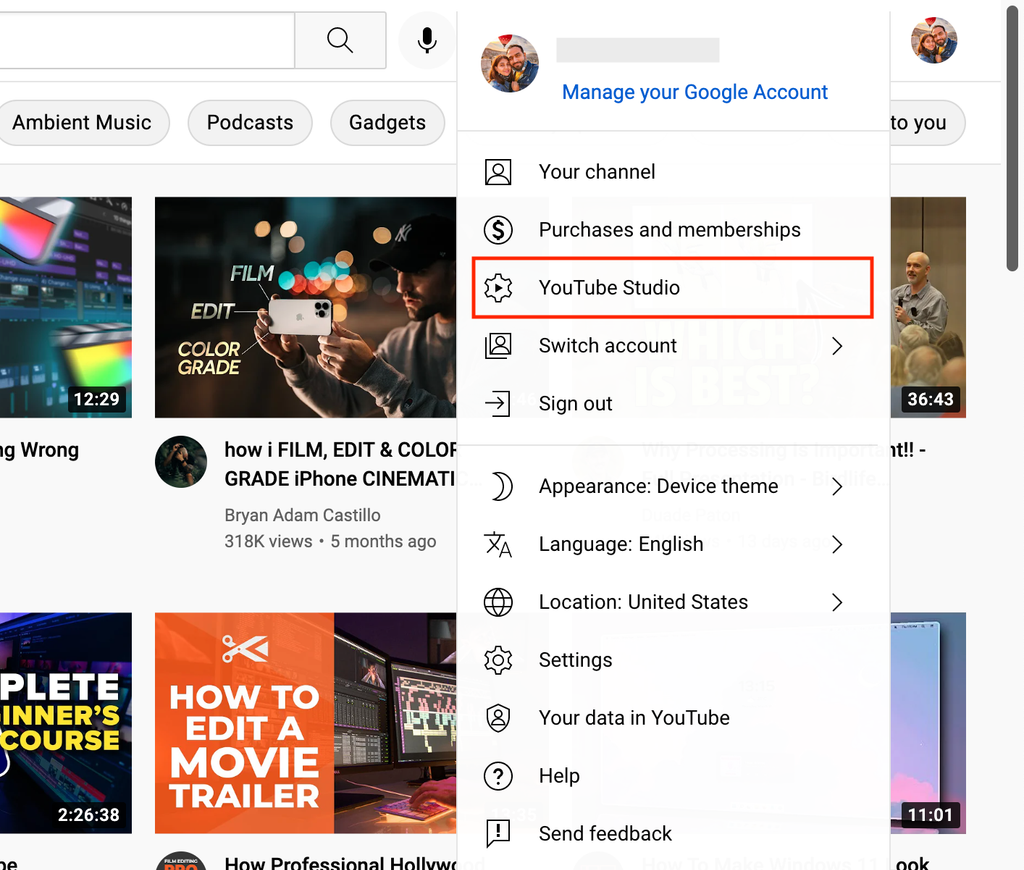
YouTube Analytics shows you:
YouTube Analytics is more than a view counter. It helps you understand which content attracts the right audience and what encourages people to keep watching, return, subscribe, or visit your website.
For example, a video with 50,000 views may generate little long-term value if viewers leave quickly and few subscribe. Another video with 5,000 views could perform better by generating more watch time, subscribers, and relevant website traffic. Looking at these metrics together gives you a clearer picture of what actually supports channel growth.
Once you identify what works, a YouTube video scheduling tool can help you plan uploads and maintain a consistent publishing schedule.
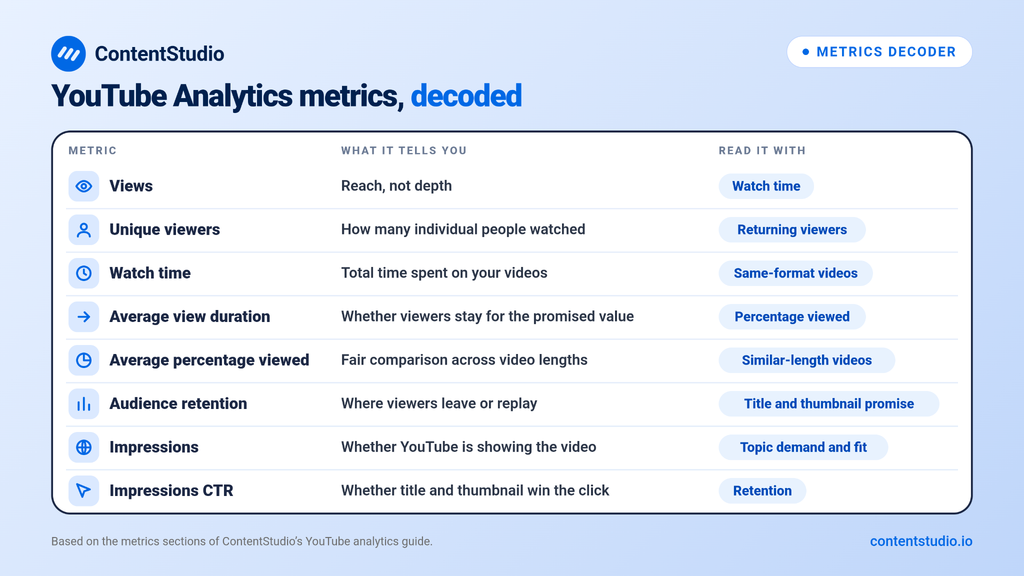
You can access channel and video analytics through YouTube Studio.
Channel-level Analytics includes Overview, Content, Audience, Revenue where eligible, and Trends. Individual-video Analytics includes Overview, Reach, Engagement, Audience, and Revenue where eligible. YouTube began gradually updating the Studio experience in July 2026, so the layout may differ between accounts.
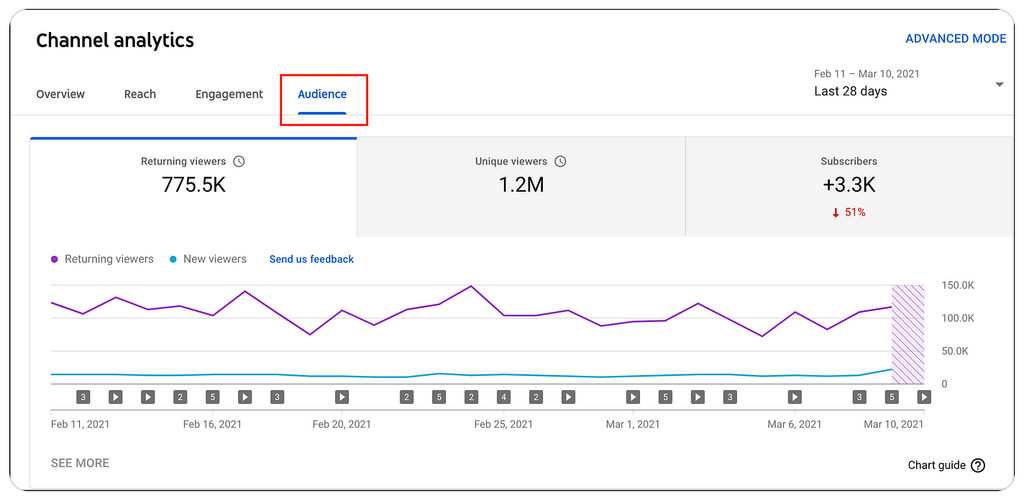
To understand why a particular video, Short, or live stream performed the way it did:
Video-level analytics are essential when you need to check impressions, click-through rate, traffic sources, viewer retention, watch time, subscriber impact, and revenue performance for one upload.
Advanced Mode helps you move beyond the standard dashboard. You can compare videos, filter content types, analyze selected periods, break down results by dimensions, and export data for stakeholder reporting.
This is particularly useful when you manage multiple content series. For instance, you can compare product tutorials, educational videos, customer stories, and YouTube Shorts to see which format brings the most watch time, subscribers, or website traffic.
If YouTube is part of a broader social strategy, a social media analytics platform can help you review YouTube performance alongside channels such as LinkedIn, Instagram, TikTok, Facebook, and X.
A useful YouTube analytics review follows the viewer journey:
Impressions → Clicks → Watch time → Return visits → Subscribers or conversions
Each stage answers a different question.
| Viewer journey stage | Key YouTube metrics | What the data tells you |
| Discovery | Impressions, traffic sources, unique viewers | Whether YouTube is showing your videos to potential viewers |
| Click decision | Impressions click-through rate | Whether your title and thumbnail persuade people to watch |
| Viewing experience | Watch time, average view duration, audience retention | Whether the video delivers on its promise and holds attention |
| Audience loyalty | Returning viewers, subscribers gained, regular viewers | Whether people want more from your channel |
| Business impact | Revenue, website clicks, conversions | Whether the video supports commercial objectives |
The goal is to find the weakest part of the journey. If people do not see your video, work on topic demand and audience fit. If people see it but do not click, improve the packaging. If they click but leave quickly, improve the opening, pacing, or relevance of the content.
YouTube offers a large amount of data. These are the metrics that matter most for understanding channel performance and improving future videos.
Views show how many valid views your videos received during the selected period.
Views are useful for measuring reach, but they do not explain whether people watched for long, found the video useful, subscribed, or visited your website. A high view count can be valuable, but it should never be the only measure of success.
Use views to identify:
A video with low views may still be strategically valuable if it drives strong watch time, subscribers, leads, or purchases.
Subscriber totals can be misleading because many subscribers may not watch every upload. Monthly audience and returning-viewer data reveal whether your channel has an active audience that continues to engage with new content.
Use these metrics to answer questions such as:
Watch time is the total amount of time viewers spend watching your videos. It is one of the most meaningful YouTube performance metrics because it shows whether people are spending time with your content rather than clicking and leaving immediately.
A video with fewer views but strong watch time may be more valuable than a viral clip that attracts many short, low-intent views.
Watch time can help you identify:
When reviewing watch time, compare similar videos. A 30-minute interview should not be judged against a 60-second Short. Compare long-form tutorials with other tutorials, Shorts with Shorts, and livestreams with livestreams.
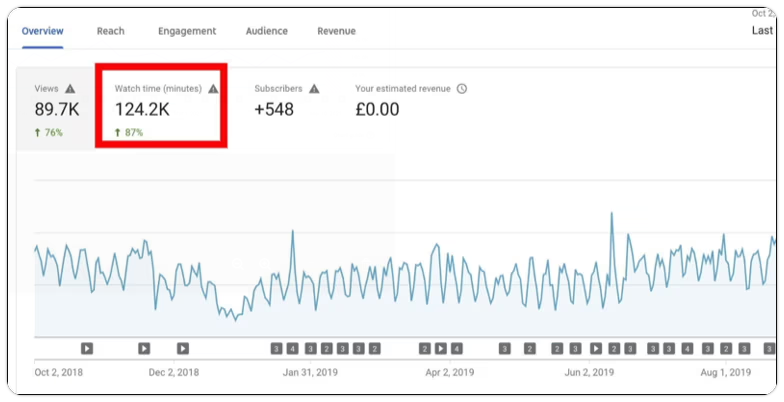
Average view duration measures the average time viewers spend watching a video. For example, if a 10-minute video has an average view duration of 4 minutes, viewers watch roughly 40 percent of the video on average.
Average view duration helps you understand whether people stay long enough to receive the value promised by the video.
A low average view duration may suggest that:
A high average view duration generally suggests that the video is holding attention, but it should still be reviewed alongside percentage viewed and audience retention.
Average percentage viewed shows the average proportion of a video watched by viewers. It is especially useful when comparing videos of different lengths.
For example:
Average percentage viewed helps you compare short and long videos more fairly. It also helps identify which formats and structures consistently hold attention.
A practical approach is to compare videos with similar lengths and similar audience intent. A detailed tutorial may have different viewing behavior than an entertainment video, product announcement, or opinion piece.
Audience retention shows how viewership changes throughout a video. It is one of the most useful reports for diagnosing why a video does or does not keep people watching.
A retention graph can reveal:
The first 30 seconds often deserve the closest attention. If a large number of viewers leave early, the issue may be the opening rather than the entire video.
Common reasons for early retention drops include:
A strong opening should quickly answer three questions:
For example, instead of beginning a tutorial with a long explanation of your channel, show the finished result, name the problem being solved, and explain what viewers will learn.
Thumbnail impressions count eligible thumbnail displays on supported YouTube surfaces. YouTube generally requires the thumbnail to remain visible for more than one second, with at least 50% visible. External embeds, notifications, and several other placements do not count toward this metric.
Impressions help you understand whether YouTube is distributing your content to potential viewers.
Low impressions can result from several factors:
Low impressions do not always mean the title or thumbnail is the problem. If few people see the video, focus first on topic selection, search demand, audience fit, and the relationship between the video and your existing content.
Impressions click-through rate, commonly called CTR, shows the percentage of people who clicked after seeing your thumbnail. CTR helps you evaluate whether your title and thumbnail work together to create interest with the right audience.
A low CTR can indicate that:
A high CTR can be positive, but it does not guarantee that a video will perform well. If viewers click but leave quickly, the title and thumbnail may be promising something the video does not deliver.
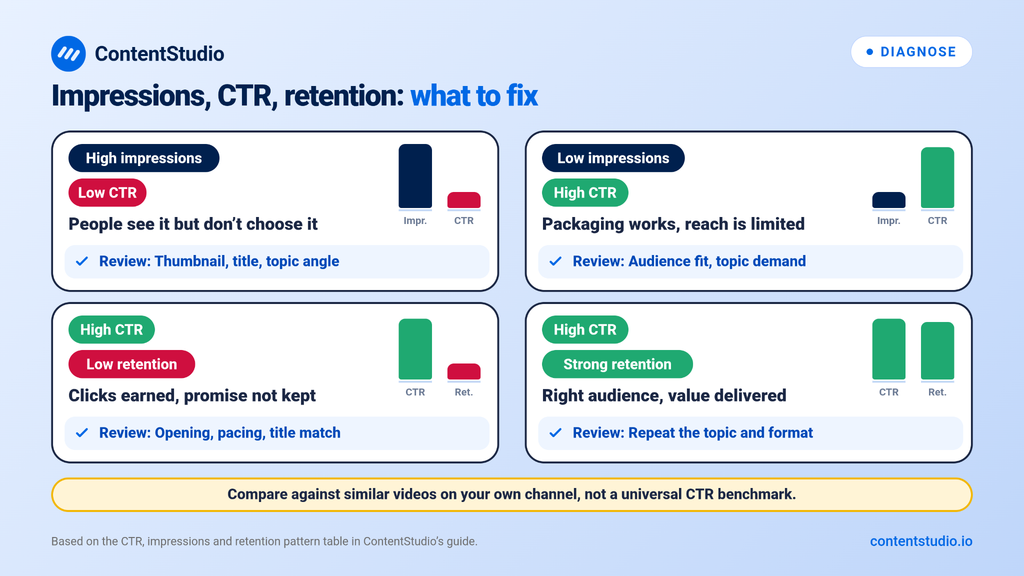
Use CTR with impressions and retention:
| Performance pattern | Likely interpretation | What to review |
| High impressions, low CTR | People see the video but do not choose it | Thumbnail clarity, title relevance, topic angle |
| Low impressions, high CTR | The packaging works with the viewers who see it, but distribution is limited | Audience fit, topic demand, retention, channel authority |
| High CTR, low retention | The packaging earns clicks but the content does not meet expectations | Opening, pacing, title and thumbnail alignment |
| High CTR, strong retention | The video is attracting the right audience and delivering value | Repeat the topic, format, structure, or packaging approach |
Do not compare your CTR to a universal benchmark. CTR varies by audience, traffic source, topic, video age, and how broadly YouTube distributes the video. Compare similar videos within your own channel first.
Traffic sources show how viewers find your videos. This report is essential because a video found through YouTube Search behaves differently from a video found through Suggested videos, Browse features, or external websites.
Common YouTube traffic sources include:
YouTube Search traffic comes from people searching for a topic, question, product, or solution. This is especially important for tutorials, how-to videos, comparisons, reviews, educational content, and evergreen topics.
Review search terms to understand:
A YouTube keyword research tool can help you identify related search themes before creating the next video. The purpose is not to cram keywords into titles. It is to understand the question behind the search and create a video that answers it clearly.
Suggested traffic comes from YouTube recommending your video beside or after related content.
Strong Suggested traffic can indicate that YouTube understands how your video connects to a relevant topic, viewer interest, or content journey.
To strengthen suggested-video potential:
Suggested traffic often grows when videos help viewers continue an existing viewing session.
Browse features generally include surfaces such as the YouTube Home page, subscription feeds, and other browsing environments. Browse performance often depends on audience familiarity, topic relevance, title and thumbnail strength, and how likely viewers are to choose your video among many options.
If Browse traffic is a major discovery source, focus on:
External traffic includes viewers arriving from websites, search engines, email campaigns, social media platforms, embedded videos, or messaging apps.
External traffic is valuable when YouTube supports a wider marketing campaign. For example, you may share a webinar clip on LinkedIn, embed a product walkthrough on a landing page, or include a tutorial in an email sequence.
Use UTM parameters when you want to understand which video links generate website visits, leads, or conversions. YouTube Analytics tells you how the video performs on YouTube. Website analytics tells you what visitors do after they leave the platform.
Subscriber data shows which videos persuade viewers to continue their relationship with your channel. A video that earns 100 subscribers from 5,000 views may be more valuable for long-term growth than a video with 50,000 views that earns only a handful of subscribers.
Review subscriber gains by video to identify:
Subscriber losses should be reviewed with context. A loss does not always mean a video was unsuccessful. It may mean that the upload reached people who are not aligned with the channel’s main focus.
The better question is: did this video attract the audience you want to keep serving?
Returning viewers are people who watched your channel before and came back during the selected period. This is one of the most valuable audience-quality signals because it shows that your content is becoming a habit rather than a one-time discovery.
Returning viewers often increase when a channel has:
If a channel gets many new viewers but few returning viewers, the content may be attracting one-off search traffic without building a lasting audience. That can still be valuable, but it may require a stronger series strategy, better end screens, more relevant playlists, or clearer reasons to subscribe.
Likes, comments, shares, playlist saves, end-screen clicks, and other interactions show how viewers respond beyond simply watching.
Engagement can help you identify:
Comments are especially useful for content planning. Look for repeated questions, audience language, product concerns, and requests for deeper explanations. These can become future videos, FAQs, tutorials, Shorts, or social posts.
A useful comment review can also improve titles. If viewers repeatedly use the same wording to describe a problem, that phrasing may help you create clearer, more relevant YouTube video titles.
Revenue reports are available to eligible channels in the YouTube Partner Program. Depending on channel eligibility and content type, these can include estimated revenue, RPM, playback-based CPM, revenue sources, and top-earning videos.
Revenue data is useful, but it should not be the only factor in content planning.
A video with fewer views may earn more revenue if it attracts viewers in a high-value market or covers a topic with stronger advertiser demand. A highly viewed video may create awareness but earn less per view. Both can be useful depending on your business model.
Review revenue alongside:
Shorts need a separate analysis because viewers often discover them through the Shorts feed rather than YouTube Search or Suggested videos.
Depending on available reporting, monitor metrics such as:
The opening seconds matter even more for Shorts. If viewers swipe away quickly, test a more direct first visual, faster pacing, a clearer hook, or a stronger on-screen promise.
If a Short receives high engagement but does not lead to subscribers or long-form views, connect it to a wider content journey. You can mention a full video, use a related video link where available, or create a clear recurring Short series around the same topic.
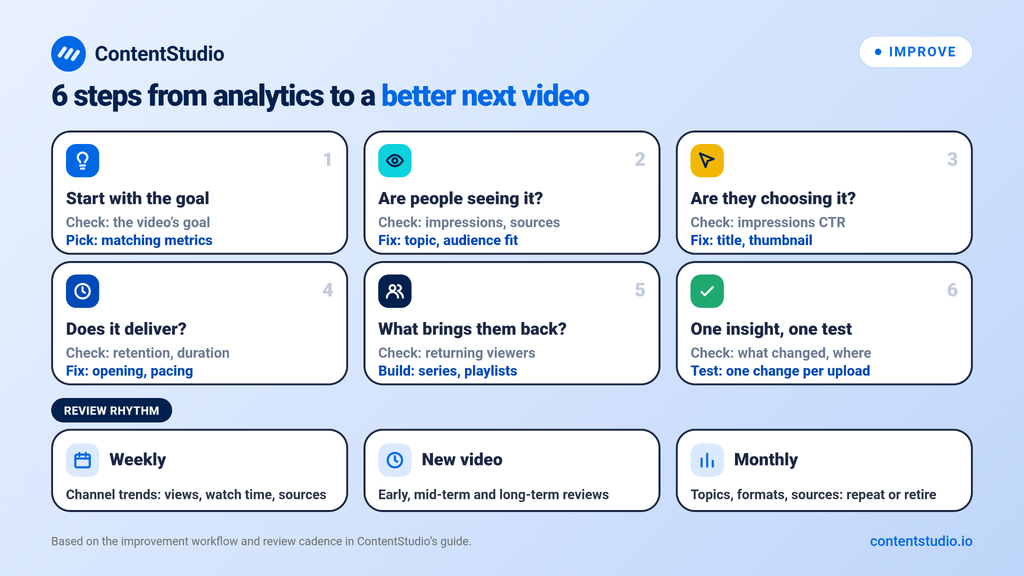
Analytics should lead to a practical decision. The following workflow helps you move from numbers to action.
Before reviewing metrics, decide what the video was meant to achieve.
A search-focused tutorial, a brand-awareness video, a product demo, and a community-driven Short should not be judged in the same way.
| Video goal | Metrics to prioritize |
| Reach a new audience | Impressions, views, unique viewers, traffic sources |
| Rank for search demand | YouTube Search traffic, search terms, CTR, average view duration |
| Build watch time | Watch time, average view duration, retention |
| Grow subscribers | Subscribers gained, returning viewers, watch time |
| Promote a product or service | Website clicks, conversions, retention, audience fit |
| Build community | Comments, shares, returning viewers, subscriber growth |
| Test Shorts content | Viewed versus swiped away, engaged views, retention, subscribers gained |
Once the goal is clear, you can ignore metrics that are interesting but not useful for that specific decision.
Start with impressions and traffic sources.
If impressions are low, investigate whether the topic is relevant to your audience and whether the video fits an existing content cluster. A new channel may need time to establish topical relevance. An unrelated topic may need stronger distribution through email, social media, or partnerships.
Do not immediately rewrite the thumbnail if the core issue is that the video is not reaching enough relevant viewers.
If impressions are healthy but CTR is low, review the title and thumbnail.
Ask:
For example, “YouTube Analytics Tips” is broad and easy to ignore. “Why Your YouTube Videos Get Impressions but No Views” creates a more specific problem-solution expectation.
The better version will only work if the video genuinely answers that problem.
If CTR is strong but retention is weak, the issue is often inside the video.
Review the opening first. The first minute should make the value obvious and build momentum toward the main answer.
A useful structure for many educational videos is:
If viewers consistently leave during a specific section, remove, shorten, or restructure that section in future videos.
Look for videos that produce strong returning viewers, watch time, subscriber gains, or repeat comments from familiar audience members.
These videos often reveal the content that should become a recurring series.
For example, if your channel’s “how we did it” case studies produce strong retention and subscribers, build a recurring case-study format. If short product tutorials drive YouTube Search traffic but few return viewers, pair them with playlists or follow-up videos that lead viewers deeper into your channel.
A planned social media content calendar can help you balance evergreen search content, recurring series, Shorts, campaign videos, and promotional uploads without relying on last-minute ideas.
Do not change every variable at once. Choose one informed test for the next upload.
Examples include:
Recording these tests helps you build a channel-specific playbook instead of relying on generic YouTube advice.
The most useful content ideas often come from your own audience data.
Review your best-performing videos across several metrics, not views alone. Look for topics that generate:
Then look for the common thread. It may be a topic, a question, a format, a type of audience problem, or a distinct content angle.
For example, if “how-to” videos about YouTube reporting attract strong search traffic, create related videos about YouTube CTR, audience retention, traffic sources, content planning, and video performance audits.
This creates topical depth for viewers and a clearer content structure for your channel.
YouTube Search terms can reveal what viewers expect from your content. If people consistently find a video through a related but unanswered query, create a dedicated video around that need. A focused video usually serves the viewer better than trying to cover every related question in one upload.
For instance, an audience searching for “how to improve YouTube CTR” may need a different video from people searching for “why YouTube impressions are low.” The two problems overlap, but they require different explanations and solutions.
A strong YouTube channel makes it easy for viewers to move from one useful video to the next. Use topic clusters to organize related content around a central audience need.
For a channel focused on YouTube marketing, a content cluster could include:
This approach can increase Suggested traffic, playlist engagement, return visits, and subscriber growth because viewers can find the next relevant step.
Your analytics should influence your content calendar, but they should not make it repetitive.
A healthy YouTube plan often includes several content roles:
A content planning workflow can help teams map these video types, assign owners, organize production deadlines, and schedule distribution across multiple social channels.
Checking analytics too often can make it difficult to see meaningful patterns. A structured review is usually more helpful.
Review channel-level data once a week to track:
This helps you spot broader trends without overreacting to daily fluctuations.
Review individual videos at key stages after publishing. The exact timing depends on your audience size, content type, and traffic sources, but the purpose is consistent:
Avoid judging a video too quickly. Search-driven content may take longer to gain momentum than a topical video shared with an existing audience.
Once a month, review the channel as a whole.
Ask:
A cross-channel reporting workflow can make this easier for agencies and marketing teams. ContentStudio can help you organize YouTube metrics alongside other social performance data, schedule reports for stakeholders, and keep your broader content operation connected.
Your next analytics review should answer one question, not inspect every metric at once. A useful starting point is a group of comparable videos with the same observation window, content format, and clearly identified traffic sources.
The review record should contain four things: what changed, which report shows it, the explanation you want to investigate, and the next action. A result may justify keeping an approach, revising a title, examining a retention timestamp, or waiting for more evidence.
The next upload brief should carry that finding into production. When several factors change together, record the result as a comparison rather than proof of one cause. This keeps the process useful without turning every percentage into an instruction to overhaul the channel.
Not every view starts with a registered thumbnail impression. External links, notifications, and other excluded placements can generate viewing activity without adding to the impressions total. Compare the impressions funnel with views from those impressions, not all video views.
Analytics and Earn measure different scopes. YPP eligibility uses qualified watch hours within its specified window, not every hour shown in Analytics. Private, unlisted, deleted, advertising, Shorts, and certain live-stream watch hours do not count toward the long-form eligibility threshold. Match the period and content eligibility before comparing totals.
Deleting permanently removes the video, but YouTube says data such as watch time remains in aggregate reports without attribution to that deleted video. Unlisting is different: anyone with the link can still watch and share it, so new viewing activity can continue. Neither action should be described as erasing all historical channel data.
YouTube limits some reports when the data does not meet its disclosure thresholds. Filters, small populations, privacy restrictions, and system limitations can produce missing values or incomplete breakdowns. YouTube does not publish the thresholds. Missing detail does not prove that no viewing occurred.
Subscribers gained measures additions, while the total also reflects losses and account adjustments. YouTube removes closed accounts and verifies activity for spam and abuse. Compare matching periods and report scopes before treating the difference as unsubscribes caused by your latest upload.
Plan 0 Days of Content in 0 Minutes
Create, schedule, publish and analyze your content across all your social media channels from one simple dashboard.
4.7 on Capterra • 16,500+ marketers trust ContentStudio
Wasiq Naeem is a Senior Content Strategist at ContentStudio and a research-driven content and digital marketing veteran. He writes on social media strategy, analytics, audience growth, and competitor analysis, covering topics like best posting times and competitor mapping. As a senior editor, he also reviews and fact-checks articles for depth and accuracy.
View all posts by Wasiq NaeemRecommended for you
Black Friday vs. Cyber Monday: The real difference for software buyers

Black Friday social media post ideas: Captions and posting plan for 2026
Black Friday and Cyber Monday social media checklist 2026

Cyber Monday social media post ideas: Captions, hashtags & retargeting posts