70 ChatGPT prompts for Facebook to drive reach and engagement
Jan 29, 202619 minutes

Written by
Saif AliUpdated
Most people who run Facebook ads read their analytics the same way: open Ads Manager, glance at the amount spent, check whether the results feel reasonable, and close the tab. That is not analytics. That is checking a receipt. Real Facebook ads analytics is the practice of turning the platform’s data into decisions, knowing which numbers to trust, where to find them, what they mean, and what to do when they move.
Get that right, and you can open any Facebook campaign and know within minutes whether it is working, why, and what to do next. That skill compounds across every campaign you will ever run, which makes it worth more than any single tactic. Here is how to build it.
Facebook ads analytics is the process of tracking, measuring, and interpreting the performance of your paid campaigns to understand what is working, what is wasting money, and what to change. It sits on top of the raw data Facebook collects, and its whole job is to convert that data into judgment.
There is an important distinction hiding inside that definition: the difference between reporting and analytics. Reporting tells you what happened. You spent this much, you got this many results, your cost per result was this. Analytics tells you what it means and what to do about it. Reporting is a photograph; analytics is a diagnosis.
Anyone can read a report. The advertisers who consistently improve are the ones who can look at the same numbers and see the story underneath: the reason costs rose, the segment quietly carrying the account, the creative that is about to burn out. The reason this matters more in 2026 than it used to is that Facebook advertising has become both more expensive and more automated.
Costs have risen across nearly every industry, competition has intensified, and much of the manual control advertisers once had over targeting has been handed to Facebook’s algorithms. In that environment, your edge is no longer clever audience building.
Before you can analyze anything, you need to know where the numbers come from. Facebook has spread its analytics across a few surfaces, and knowing which one to open for which job saves a surprising amount of time.
The center of gravity for paid analysis is Ads Manager. This is where your day-to-day campaign performance lives, and it is where you will spend the vast majority of your analytical time. Everything that follows in this guide happens here unless stated otherwise.
Sitting above it is Meta Business Suite, which gives a broader view across both Facebook and Instagram and blends paid with organic. It is useful for a high-level overview and for audience trends, but for granular campaign work, Ads Manager is the sharper tool. Think of Business Suite as the wide-angle lens and Ads Manager as the zoom.
Underneath both is Events Manager, which is where your tracking is configured: the Pixel and the Conversions API that tell Facebook what happened after someone clicked. You will not do daily analysis here, but it is worth knowing it exists, because the quality of everything you see in Ads Manager depends on it.
There is a fourth option worth knowing about, and it sits above all three. Facebook’s native surfaces are capable but scattered, and they only ever show you what happens inside Facebook, in an interface built for managing ads rather than reading them.
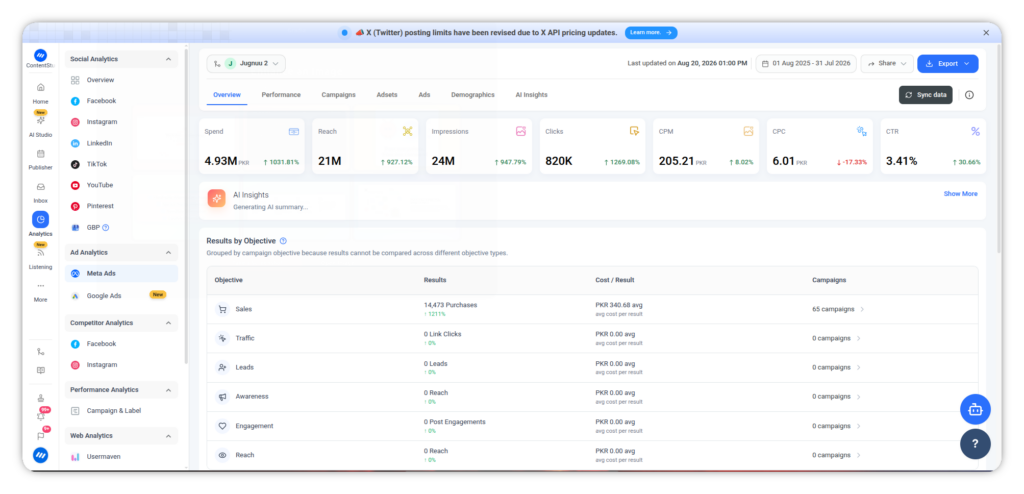
A dedicated Meta analytics dashboard such as ContentStudio’s pulls your Facebook ad performance into one clean, purpose-built view that sits alongside the rest of your social data, so instead of clicking between tabs and rebuilding reports, you get the metrics that matter in a layout designed for reading rather than for configuration.
Facebook organizes every ad account into three levels, and understanding this hierarchy is the foundation of reading the data, because the same metric means different things at different levels.
At the top is the campaign, which is where you set the objective, the single most important decision in the whole account because it determines what Facebook optimizes for and therefore which metrics matter.
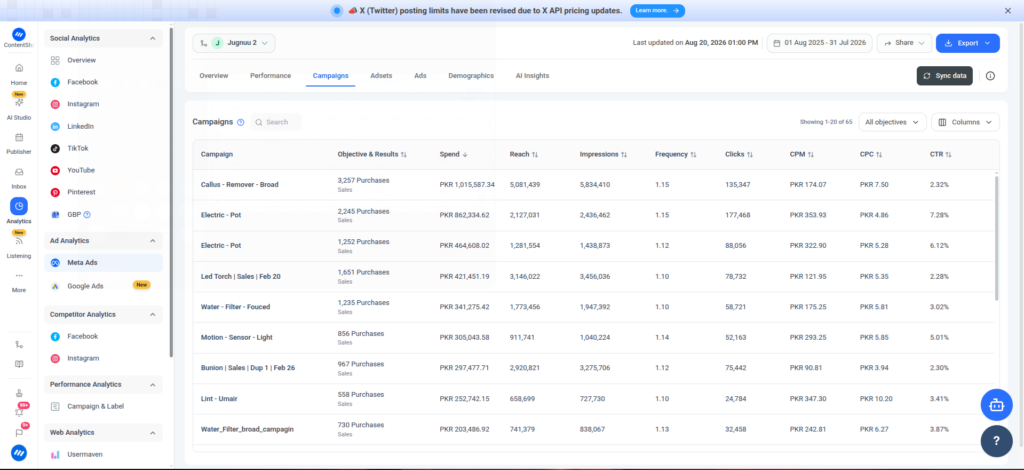
Beneath that is the ad set, which controls the audience, the placements, the budget, and the schedule. This is the level where most of your optimization decisions actually get made, because it is where budget meets audience. At the bottom is the ad itself, the creative that people see.
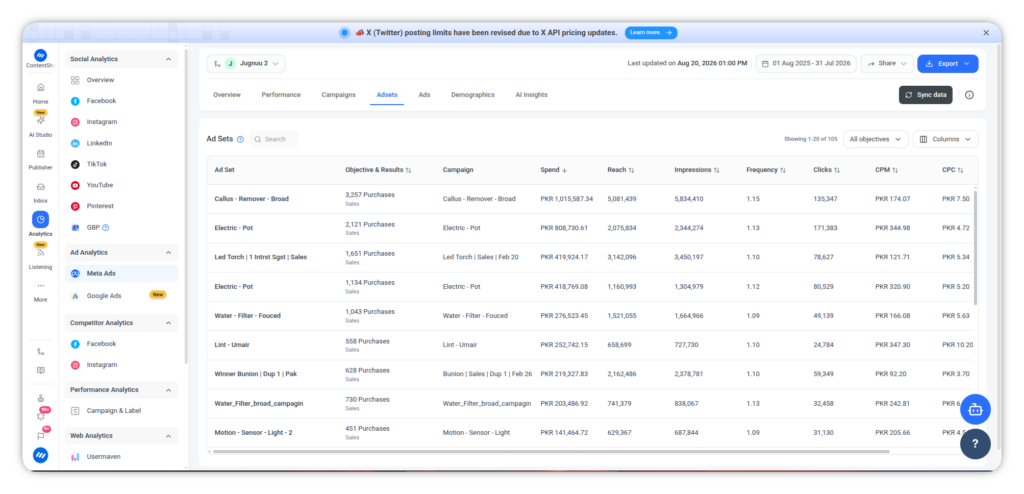
Here is a truth most guides skip: the default Ads Manager view is close to useless for real analysis. Out of the box, it shows you delivery, budget, amount spent, reach, impressions, CPM, link clicks, CPC, and CTR. Notice what is missing from that list: the conversions.
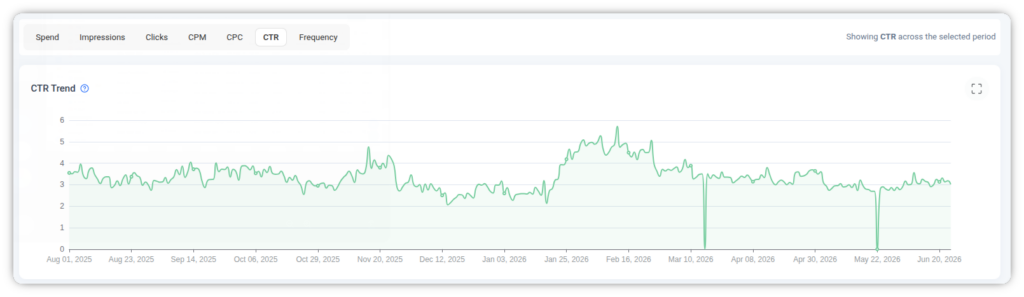
The default view shows you what you paid and how far it went, but almost nothing about whether it worked. Fixing this is the single highest-value thing you can do before you analyze anything.
The columns are customizable, and every experienced advertiser sets up their own. Click the Columns dropdown above the data table and either choose a preset or, better, build a custom set. The goal is to lead with the metrics that reflect your objective: cost per result and return on ad spend for a sales campaign, cost per lead for a lead campaign, and to push the vanity metrics to the far right or off the view entirely.
The metrics to demote are the ones that feel like progress but rarely correlate with outcomes: reach, impressions, link clicks, and post engagement. They are not useless, but leading with them is how advertisers convince themselves a campaign is working when it is quietly losing money. Once you have built a column set you like, save it as a preset so every campaign opens in a view that answers your real questions at a glance.
This is also where a purpose-built analytics dashboard starts to pull ahead of the native tool. Ads Manager will show you these numbers once you have wrestled the columns into shape, but it makes you do that setup, remember your presets, and rebuild the view every time you want a different angle.
A dedicated dashboard like Facebook ads analytics in ContentStudio leads with the outcome metrics by default and groups results by objective automatically, so you skip the configuration and start reading immediately.
That difference sounds small until you are doing it across a dozen campaigns or several clients, at which point the time saved is the difference between analysis you do and analysis you keep meaning to do.
Attribution is one of the most misunderstood parts of Facebook analytics, and it quietly shapes every conversion number you see. The attribution window determines which conversions Facebook credits to your ads, and how long after a click or view it keeps counting them.
A shorter window credits fewer conversions; a longer one credits more. This means the exact same campaign can report very different results depending on the setting. The practical guidance is to match your window to your sales cycle. An impulse purchase settles within a day or two, so a short click window tells the truth.
A considered purchase that takes a week of deliberation needs a longer window, or you will undercount conversions that your ads genuinely caused. Pick a window, keep it consistent, and remember when comparing campaigns that they must share the same setting, or the comparison is meaningless.
With your columns set and your attribution window chosen, you can read the metrics. There are dozens available, but a manageable handful carry most of the meaning. The trick is not memorizing them all; it is reading them in the right order, from what you paid to what you got.
Here are the metrics worth anchoring to, grouped by what they tell you:
| Metric | What it measures | What it tells you |
| CPM | Cost per 1,000 impressions | How expensive it is to reach your audience |
| CTR | Click-through rate | Whether your creative and message land |
| CPC | Cost per click | The efficiency of getting a click |
| Frequency | Avg. times each person saw the ad | Whether fatigue is setting in |
| Conversion rate | Clicks that become results | Whether the click turns into value |
| Cost per result | Cost of each conversion | The true efficiency of the campaign |
| ROAS | Revenue per dollar spent | Whether the campaign pays for itself |
CPM is the cost to reach a thousand people, and it is the truest read on how competitive your audience is. A climbing CPM usually means a saturated audience, a crowded auction, or a stale creative losing relevance.
CTR is the percentage of people who clicked after seeing your ad, and it is the clearest single signal of whether your creative is working. On Facebook, where visual quality decides whether someone stops scrolling, a weak CTR almost always points at the creative or the targeting.
CPC is what each click costs, and it folds CPM and CTR together. A high CPM with a strong CTR can still produce a reasonable CPC; a high CPM with a weak CTR produces an expensive one. Never read CPC alone.
Frequency is the average number of times each person saw your ad, and it is the metric most people ignore until a campaign has already decayed. When it climbs past a certain point, fatigue sets in and everything else starts to slide.
Conversion rate is the percentage of clicks that become the result you care about. It is the bridge between engagement and outcome, and when your cost per result rises but your CPC looks fine, this is usually where the problem hides.
Cost per result is what you paid for each conversion, and for most campaigns it is the single most important number, far more useful than cost per click, because a click is not the goal.
ROAS is revenue divided by spend, the number that tells you whether the campaign pays for itself. It is powerful but easy to misread, since it says nothing about profit on its own and the platform-reported figure is usually rosier than your true blended return.
The discipline that ties these together is reading them in sequence. Start with the objective, then read CPM to judge delivery, CTR and CPC to judge engagement, cost per result and ROAS to judge the outcome, and frequency to catch decay before it spreads.
If there is one habit that separates people who understand their account from people who merely look at it, it is breaking metrics down by segment. A breakdown takes any metric and splits it by a dimension, which is how you find the pockets of performance that account-level and campaign-level averages quietly hide.
Facebook’s native Breakdown menu can do this, and it is the most underused tool in the interface, but it also buries the feature and makes you rerun it dimension by dimension, which is exactly why most advertisers skip the step that would tell them the most.
An average is a blend, and a blend can conceal two very different stories cancelling each other out. A campaign with a mediocre cost per result might contain one excellent placement and one terrible one, or one age group carrying the account while another drains it. You will never see that in the top-line number. You will see it the moment you break it down.
The breakdowns worth running regularly are these:
| Breakdown | What it reveals |
| By age and gender | Where your conversions actually come from |
| By time | Trends over days and weeks, and dayparting patterns |
| By platform | How Facebook delivery compares to Instagram in a blended campaign |
| By region | Which geographies convert and which burn budget |
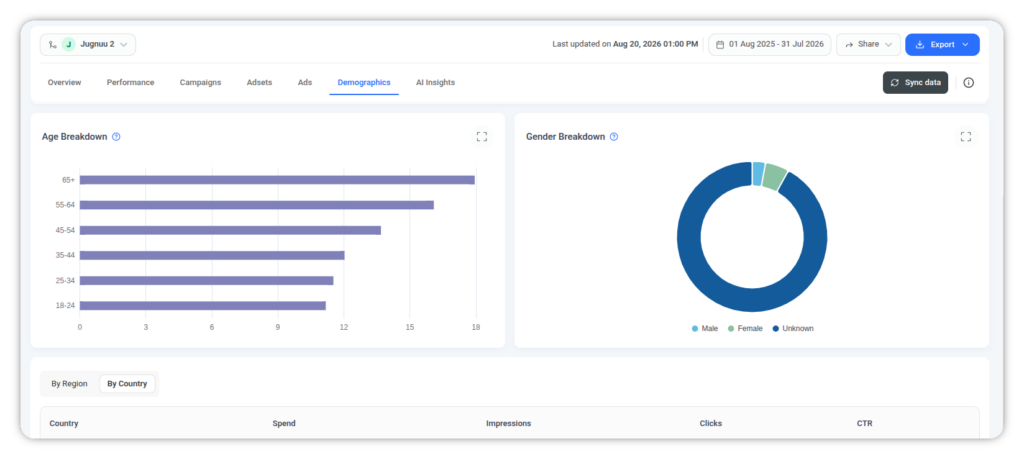
The same logic applies to demographics and geography: the segment view tells you exactly what to change, where the average only tells you that something is vaguely off. The practical habit is to treat breakdowns as your diagnostic step. When a campaign underperforms, and you cannot see why from the top-line numbers, break it down before you touch anything.
Some dashboards, ContentStudio among them, surface these segment views without the manual digging Ads Manager requires, which makes the diagnostic step quick enough that you actually do it every time rather than only when something is obviously wrong.
Frequency deserves its own section because it explains more mysterious Facebook ad declines than any other metric, and almost nobody watches it until it is too late. Frequency is the average number of times each person has seen your ad, and on Facebook in 2026 it matters more than it once did.
Here is the pattern that plays out constantly. A campaign launches and performs well. Over the following weeks, if the audience is not large enough to keep supplying fresh people, the same users start seeing the same ad again and again. Frequency climbs.
Once it passes a threshold, usually somewhere around three to four exposures in a short window depending on the audience and the creative, fatigue sets in. People have already decided, and now they are simply tuning the ad out. The damage shows up everywhere at once.
CTR falls because people stop clicking something they have seen too often. CPM often rises because Facebook struggles to place a stale ad efficiently. Cost per result creeps up as fewer clicks convert. From the outside, it looks like the whole campaign is decaying, when the real culprit is one number quietly climbing in a column you probably were not watching.
The reason to care is that frequency gives you an early warning the outcome metrics do not. A rising frequency paired with a slipping CTR today is telling you your cost per result will rise next week, while there is still time to refresh the creative or widen the audience.
All of this reading is only worth something if it ends in a decision. Analytics that does not change what you do is just an expensive hobby. The good news is that no matter how complex the data looks, the decisions available to you are few, and every analysis should end in one of them.
The value of everything above, the columns, the breakdowns, the frequency check, is that it points clearly at one of these four actions. If you have analyzed a campaign and still cannot say whether to scale, sustain, fix, or kill it, you have not finished analyzing.
Facebook ads analytics works best as a rhythm, not a panic response to a bad week. The accounts that perform most consistently are the ones where analysis is a regular habit, and the rhythm does not need to be complicated.
| Cadence | What to do | Time |
| Daily | Glance at spend and results to catch anything badly broken | 2 minutes |
| Weekly | Run breakdowns, read trends, make scale-or-cut decisions | 30 minutes |
| Monthly | Review the longer trend, reassess targets and creative strategy | 1 hour |
The daily glance catches fires. The weekly session actually steers the account, where you run your breakdowns, read your trends, check frequency, and decide what to scale, sustain, fix, or kill. The monthly review pulls back to set direction, whether your targets still make sense, which creative themes are winning, and where the account is heading over a longer horizon.
The friction in this routine is almost always the data gathering. If pulling last month’s numbers next to this month’s, or reassembling a client-ready view, takes half an hour of exporting and reformatting, the routine quietly dies. This is where keeping your Facebook ads data in one place earns its keep.
When your campaign performance sits alongside the rest of your social analytics in a tool like ContentStudio, and comparisons and exports are a click rather than a chore, the weekly session takes minutes instead of an afternoon, and a routine that takes minutes is a routine you will actually keep.
A few mistakes come up again and again, and knowing them in advance saves a lot of wasted spend.
Facebook ads analytics is a skill with a shape: set your columns to show outcomes, read the metrics in order from what you paid to what you got, break down the averages to find the real story, watch frequency as your early warning, and finish every analysis with a decision to scale, sustain, fix, or kill. Do it on a regular rhythm, and Facebook advertising stops feeling like a slot machine and starts feeling like something you steer.
The one thing that makes all of it easier is where you do the reading. Native Ads Manager can surface these numbers, but it makes you fight the interface every time, which is why so much analysis never happens.
ContentStudio puts your outcome metrics up front, your segments a click away, and a client-ready report a couple of clicks after that, turning analytics from a chore into a habit you will actually keep.
Facebook ads analytics is the process of tracking, measuring, and interpreting the performance of your paid Facebook campaigns to decide what is working, what is wasting money, and what to change. It goes beyond basic reporting, which tells you what happened, by focusing on what the numbers mean and what to do about them.
Your paid campaign analytics live in Meta Ads Manager, which is where day-to-day performance analysis happens. Many advertisers also use a dedicated dashboard like ContentStudio, which pulls your Facebook ad performance into one clean view alongside the rest of your social data, so you can read, compare, and report without rebuilding the native reports each time.
The metrics that carry the most meaning are cost per result and ROAS for judging outcomes, CTR and CPC for judging creative and efficiency, CPM for judging delivery cost, and frequency for catching fatigue. Which one matters most depends on your campaign objective, since a sales campaign and a traffic campaign should be judged on different numbers.
Rising costs usually come from one of a few sources: a saturated audience being shown your ad too often, a crowded auction, or a stale creative losing relevance. Check your frequency first, since a climbing frequency paired with a falling CTR is the most common early cause of rising costs, and it is fixable with fresh creative or a broader audience.
A breakdown splits any metric by a dimension such as placement, age, gender, time, platform, or region. It is the most powerful diagnostic tool in Ads Manager, because it reveals the pockets of good and bad performance that account-level averages hide, showing you exactly which segment to scale or cut.
A useful rhythm is a two-minute daily glance to catch anything badly broken, a proper weekly session to run breakdowns and make decisions, and a monthly review of longer trends and targets. Checking obsessively tends to make you react to daily noise rather than meaningful trends.
Reporting tells you what happened, such as how much you spent and how many results you got. Analytics tells you what it means and what to do about it, such as why costs rose or which segment is carrying the account. Reporting is a photograph; analytics is a diagnosis.
Plan 0 Days of Content in 0 Minutes
Create, schedule, publish and analyze your content across all your social media channels from one simple dashboard.
4.7 on Capterra • 16,500+ marketers trust ContentStudio
Saif Ali is a Content Marketing Strategist at ContentStudio with over five years of experience across SaaS, IT, and digital marketing. He specializes in SEO-led content, AI content creation, and social media strategy, and leads editorial review at ContentStudio, fact-checking and refining articles for accuracy, SEO, and a consistent brand voice.
View all posts by Saif AliRecommended for you
70 ChatGPT prompts for Facebook to drive reach and engagement
Facebook cover photo size: The complete 2026 guide
Ultimate guide to schedule Facebook posts, Reels & Stories
Best time to post on Facebook in 2025