
95% of marketers use AI. Only 39% see better performance. The gap isn’t the AI
Oct 7, 20268 minutes

Written by
Saif AliPublished
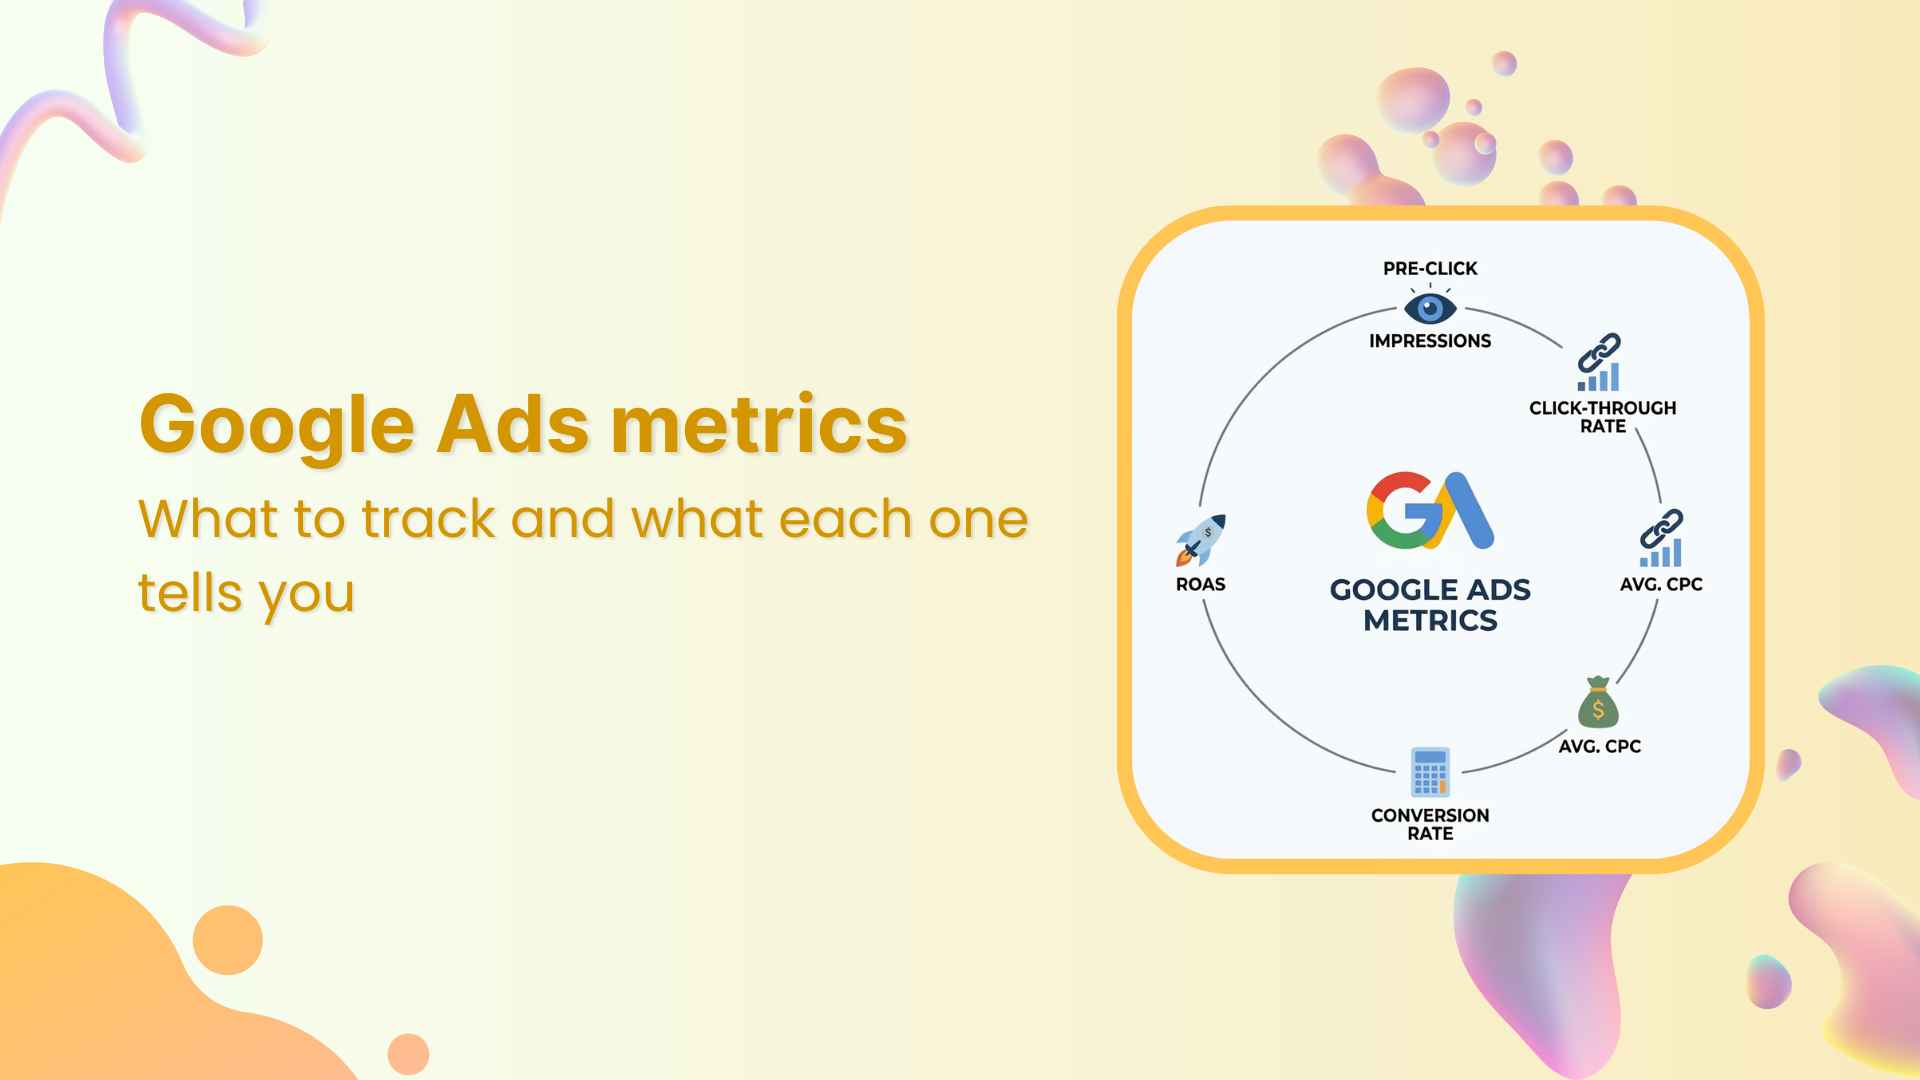
Open any Google Ads account, and you’ll find dozens of columns. A Google Ads analytics dashboard can help you bring the key numbers into one view, but on a normal day, most of those columns are still noise. About a dozen tell you whether your money is working, and they only make sense when you read them together.
This guide covers the Google Ads metrics worth tracking, the formula behind each one, what it usually means when a number moves, and which metric to check next. That last step is where most troubleshooting goes wrong. People react to one number without asking what pushed it.
Google Ads metrics are the numbers that measure how your ads perform, from how often they show to how much each lead or sale costs. They fall into four groups: reach, engagement, cost, and results.
Reach and engagement tell you whether people see and click your ads. Cost and results tell you whether those clicks are worth paying for.
A metric is any number Google Ads reports. A KPI is the metric you’ve chosen to judge success.
For an online store, the main KPI is usually return on ad spend. For a lead generation business, it’s usually cost per conversion. Pick your Google Ads KPIs first. Then use everything else to explain why those KPIs moved.
Here are the 12 Google Ads performance metrics that do most of the work, grouped by the question each one answers.
| Group | Metrics | The question it answers |
|---|---|---|
| Reach | Impressions, Impression Share | Are people seeing my ads? |
| Engagement | Clicks, CTR | Do they find the ads worth clicking? |
| Cost | Spend, Avg CPC, Quality Score | What am I paying, and why? |
| Results | Conversions, Conv. Rate, Cost per Conversion, Conversion Value, ROAS | Is the spend paying off? |
The order matters. Problems usually flow down the list. A reach problem becomes a clicks problem, which becomes a results problem. When you trace a drop, start at the bottom and work up until you find the first number that moved.
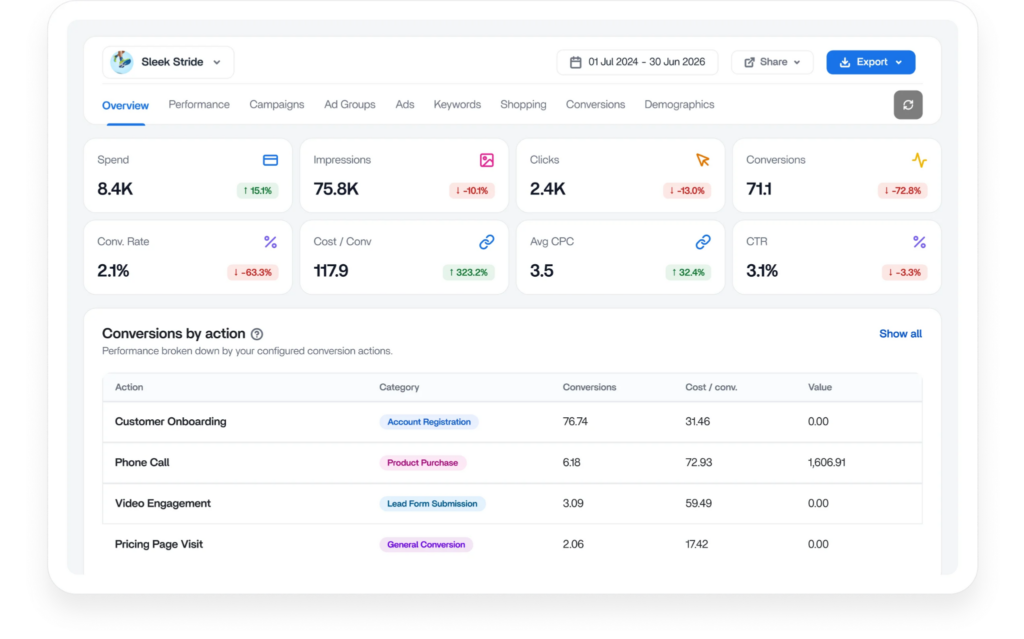
That’s also why period-over-period change matters more than the raw number. Knowing CTR is 3.1% tells you little. Knowing it fell 3% since last month tells you where to look.
Impressions count how many times your ads were shown.
A rise in impressions isn’t always good news. If impressions climb while clicks stay flat, your ads are probably showing for searches that don’t fit. That often happens after switching keywords to broad match.
A drop usually has one of three causes: your budget ran out earlier in the day, your bids fell below what competitors pay, or search demand dropped. Seasonal dips are normal, so compare against the same period last year before you panic.
Check next: Impression share, to see whether you’re losing auctions or running out of budget.
Impression share is the percentage of impressions you received out of all the impressions you were eligible for.
Impression share = Impressions ÷ Eligible impressions
This metric is most useful when you split it. Google reports two reasons you missed impressions:
The fixes are completely different. Budget losses need more money or tighter targeting. Rank losses need better ads, better landing pages, or higher bids. Adding budget to an account that’s losing on rank just buys more of the same weak placements.
Check next: Quality Score, if you’re losing on rank.
Clicks count how many times people clicked your ads.
On their own, clicks tell you very little, because you pay for every one. The useful question is whether clicks and conversions move together. If clicks go up and conversions stay flat, you’re buying traffic that doesn’t buy from you.
Check next: The search terms report, to see which queries sent the extra clicks.
CTR is the percentage of impressions that turned into clicks.
CTR = Clicks ÷ Impressions × 100
CTR is your clearest signal of ad relevance. A falling CTR usually points to one of these:
Always read CTR next to impressions. A CTR drop paired with an impression spike usually means you’re showing to a wider, weaker audience. A CTR drop with steady impressions means the ad itself got less appealing.
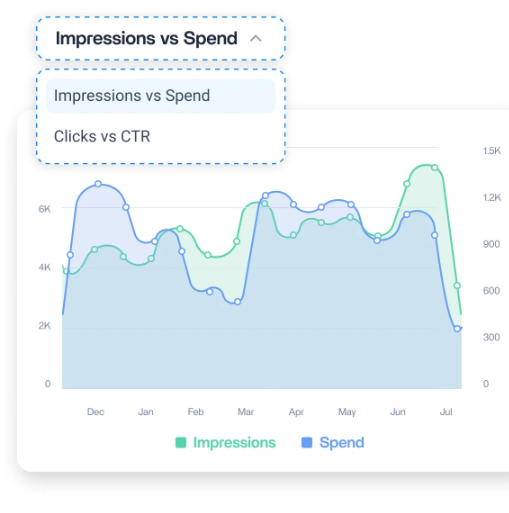
The same logic applies to spend. Plot impressions against spend over a few months and you’ll see the point where extra budget stops buying extra reach.
Check next: Search terms and ad copy.
Spend is the total amount you paid for clicks in a given period.
Spend isn’t good or bad by itself. What matters is whether it grows in step with results. If spend rises 20% and conversions rise 20%, you’ve scaled. If spend rises 20% and conversions rise 5%, efficiency is slipping.
Check next: Cost per conversion and average CPC.
Average cost per click is what you pay, on average, for each click.
Avg CPC = Spend ÷ Clicks
A rising CPC means more advertisers are competing for the same searches, or Google rates your ads lower than it used to. The first is outside your control. The second isn’t.
Check next: Quality Score and the auction insights report, which shows who you’re competing against.
Quality Score is Google’s 1 to 10 rating of how relevant your keyword, ad, and landing page are to each other.
It’s built from three parts:
Quality Score isn’t a direct input to the auction, but it’s a strong diagnostic for the things that are. Low scores tend to go hand in hand with higher CPCs and lower positions.
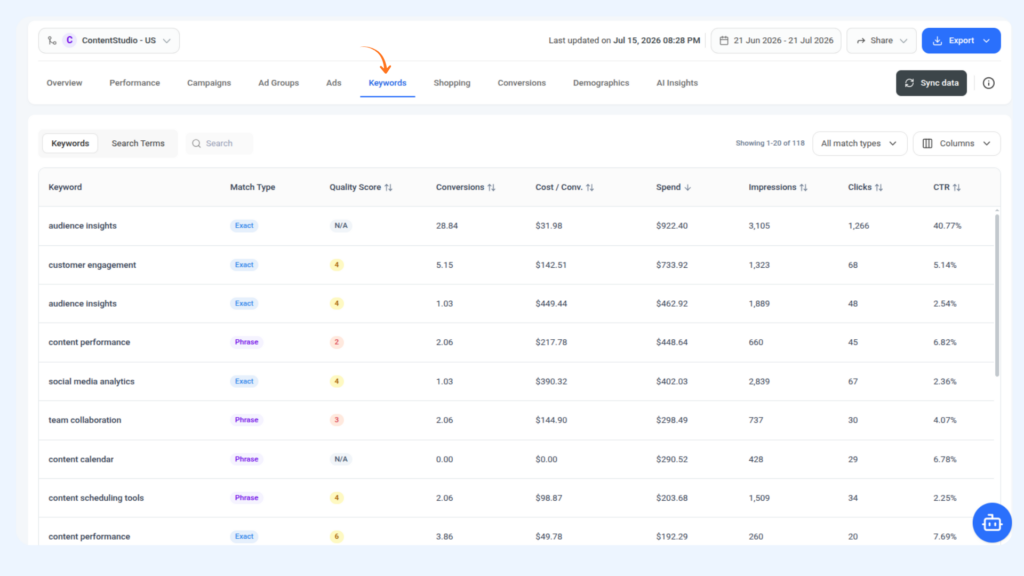
The fastest way to find the problem keywords is to sort by spend and read Quality Score next to it. A keyword scoring 2 or 3 that has spent hundreds without converting is one of the most common leaks in any account.
Check next: Whichever of the three components is marked “Below average.”
Conversions count the valuable actions people took after clicking, such as purchases, sign-ups, calls, or form submissions.
The biggest trap here is tracking. If conversions drop sharply overnight while clicks stay steady, check conversion tracking before you touch the campaigns. A broken tag or a changed thank-you page URL is far more likely than a sudden change in buyer behavior.
It also helps to know what’s being counted. The Conversions column includes only actions set as primary. If a pricing page visit counts as primary next to real purchases, your conversion total will look healthier than your revenue.
Breaking conversions down by action shows which ones carry the account and which just pad the number.
Check next: Conversion tracking status, then conversions by action.
Conversion rate is the percentage of clicks that turned into conversions.
Conversion rate = Conversions ÷ Clicks × 100
When conversion rate drops and CTR holds, the ad is doing its job, and the page isn’t. People click because the ad promised something, then leave because the page didn’t deliver. Look at load speed, the offer, and whether the page matches what the ad said.
A simple funnel view makes this obvious. If the fall from impressions to clicks looks normal but the fall from clicks to conversions is steep, the problem sits after the click.
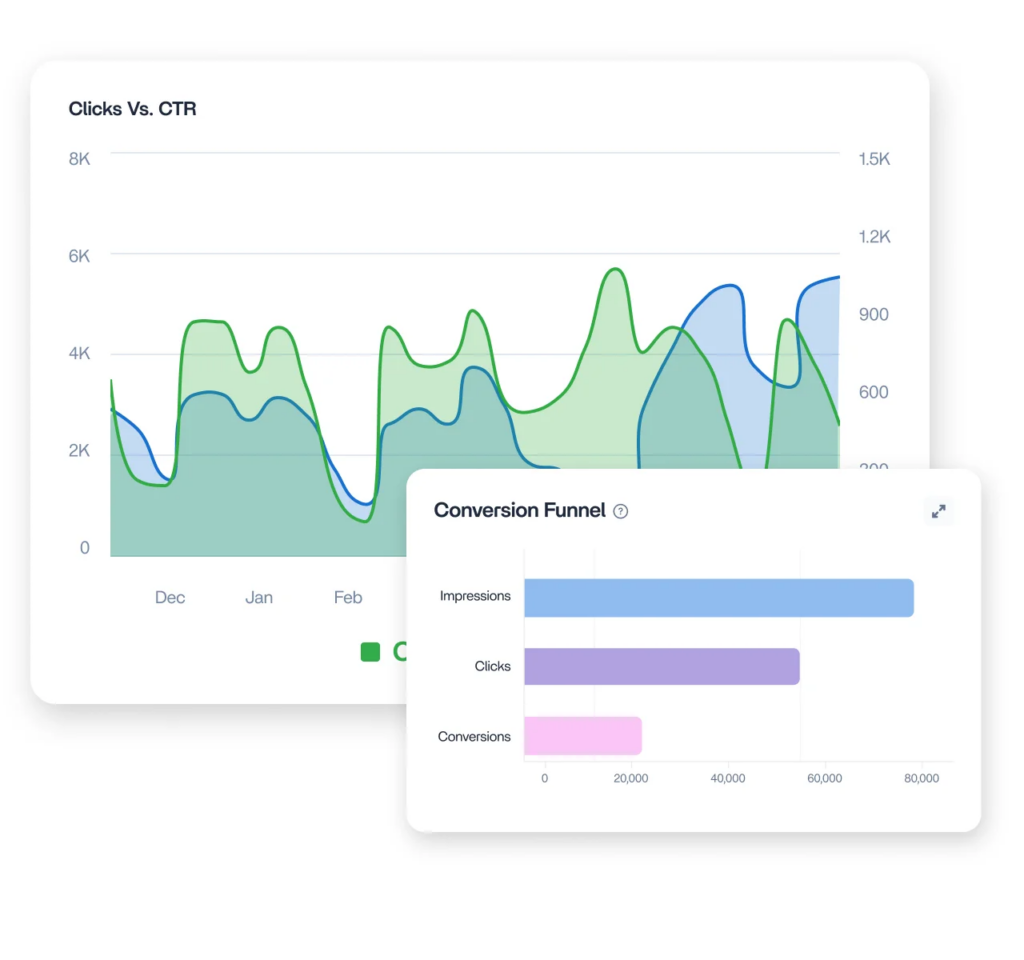
Check next: The landing page, then the intent behind your search terms.
Cost per conversion is what you pay, on average, for each conversion.
Cost per conversion = Spend ÷ Conversions
For lead generation accounts, this is usually the number that matters most. It’s also the one people misread most, because it never moves on its own. More on that below.
Check next: Average CPC and conversion rate, every time.
Conversion value is the total revenue or value assigned to your conversions.
For ecommerce, this usually comes straight from order totals. For lead generation, you assign values yourself. If a qualified demo is worth more than a newsletter sign-up, give each its own value. Otherwise, every conversion counts the same, and your reports hide which campaigns bring the leads you want.
Check next: Whether every conversion action has a realistic value.
Return on ad spend is how much conversion value you earn for every unit of currency spent.
ROAS = Conversion value ÷ Spend
A ROAS of 4 means you earned $4 for every $1 spent. Whether that’s good depends on your margins. To find your break-even point:
Break-even ROAS = 1 ÷ Profit margin
At a 25% margin, you need a ROAS of 4 just to break even. At 50%, you need 2. That’s why a single “good ROAS” benchmark is close to useless.
Account-level ROAS also hides a lot. In Shopping campaigns, a couple of products often carry the rest. Look at ROAS by product group, and you’ll usually find one item earning five times its spend next to another that barely covers two.
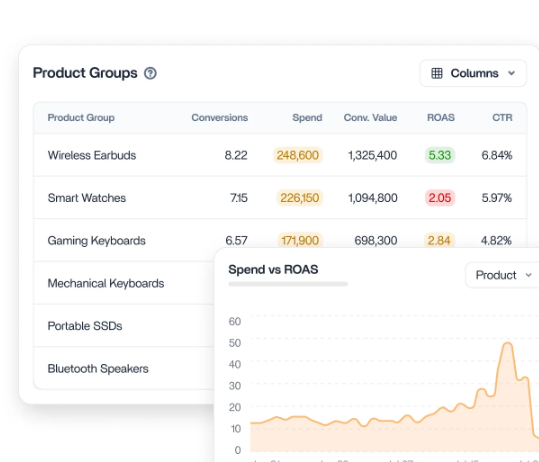
Check next: ROAS by campaign or product group.
This is where most of the value sits. Google Ads performance metrics are linked by simple math, so when one number moves, you can usually trace it to another.
The most useful relationship in the whole account is this one:
Cost per conversion = Avg CPC ÷ Conversion rate
Say you pay $2 per click and 4% of clicks convert. Your cost per conversion is $50. Next month it jumps to $70. Only two things could have caused that:
Those paths lead to completely different fixes. Knowing which one you’re on saves you from rewriting ads when the real problem is the checkout page.
| What you see | Likely cause | Check next |
|---|---|---|
| Spend up, conversions flat | Paying for irrelevant searches | Search terms report |
| Impressions up, CTR down | Broader matching or weaker placements | Match types, search terms |
| CTR steady, conversion rate down | Landing page or offer issue | Landing page, page speed |
| Clicks steady, conversions near zero | Broken conversion tracking | Tag status, thank-you page |
| CPC up, impression share lost to rank up | Falling ad quality | Quality Score components |
| Impression share lost to budget high | Budget runs out early | Daily budget, ad schedule |
| Cost per conversion up | CPC up or conversion rate down | Split the two |
Knowing the metrics is half of it. The other half is reading them without chasing noise.
Compare equal periods: Put this week against last week, or this month against the same month last year. A 31-day month against a 28-day month will always look like growth.
Watch for conversion lag: Google credits conversions to the day of the click, not the day of the purchase. If buyers take a week to decide, the last few days of any report will look weak and fill in later. Don’t pause a campaign based on yesterday’s numbers.
Set a minimum sample: A keyword with 15 clicks and no conversions might be bad or might be unlucky. Decide on a click or spend threshold before you judge it.
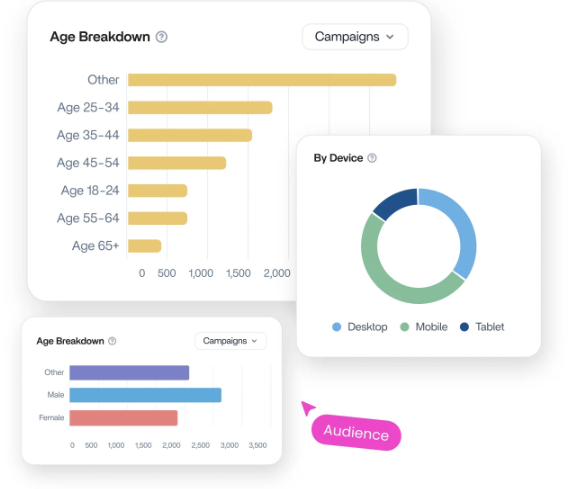
Segment before you judge: An average can hide two very different stories. Mobile might bring most of the clicks while desktop brings most of the conversions. Split key metrics by device, age, gender, and location before you cut a campaign that’s quietly working for one audience.
Lead with your Google Ads KPIs: conversions, cost per conversion, conversion value, and ROAS. That’s what clients pay for, and it’s what they’ll remember.
Use the other metrics as evidence. If cost per conversion went up, show whether CPC or conversion rate caused it. That turns a bad month from “the numbers are down” into “competition pushed click costs up 30%, and here’s the plan.”
Leave out raw impressions unless the campaign’s goal is awareness. Big impression numbers answer none of the questions a client actually has.
Most teams check ad metrics in one tool, social performance in another, and build client reports in a third. That’s a lot of tabs for one question: is the marketing working? ContentStudio covers your ads too.
The same platform you use to plan, schedule, and publish social posts, write with AI, and automate workflows includes a Google Ads analytics dashboard. Your paid search numbers sit next to your social media analytics, so you never leave the dashboard to check on ads. It’s built to be read quickly.
Every metric in this guide has a home in a clear set of tabs: an overview with period-over-period change on each number, conversions by action, keywords next to the search terms people actually typed, product-level ROAS for Shopping, the conversion funnel, and audience breakdowns by age, gender, device, and location.
Getting set up takes four steps:
Social Media Analytics
Fine-tune your social media strategy for success with in-depth analytics and white-labeled reports.
Get Started for FREE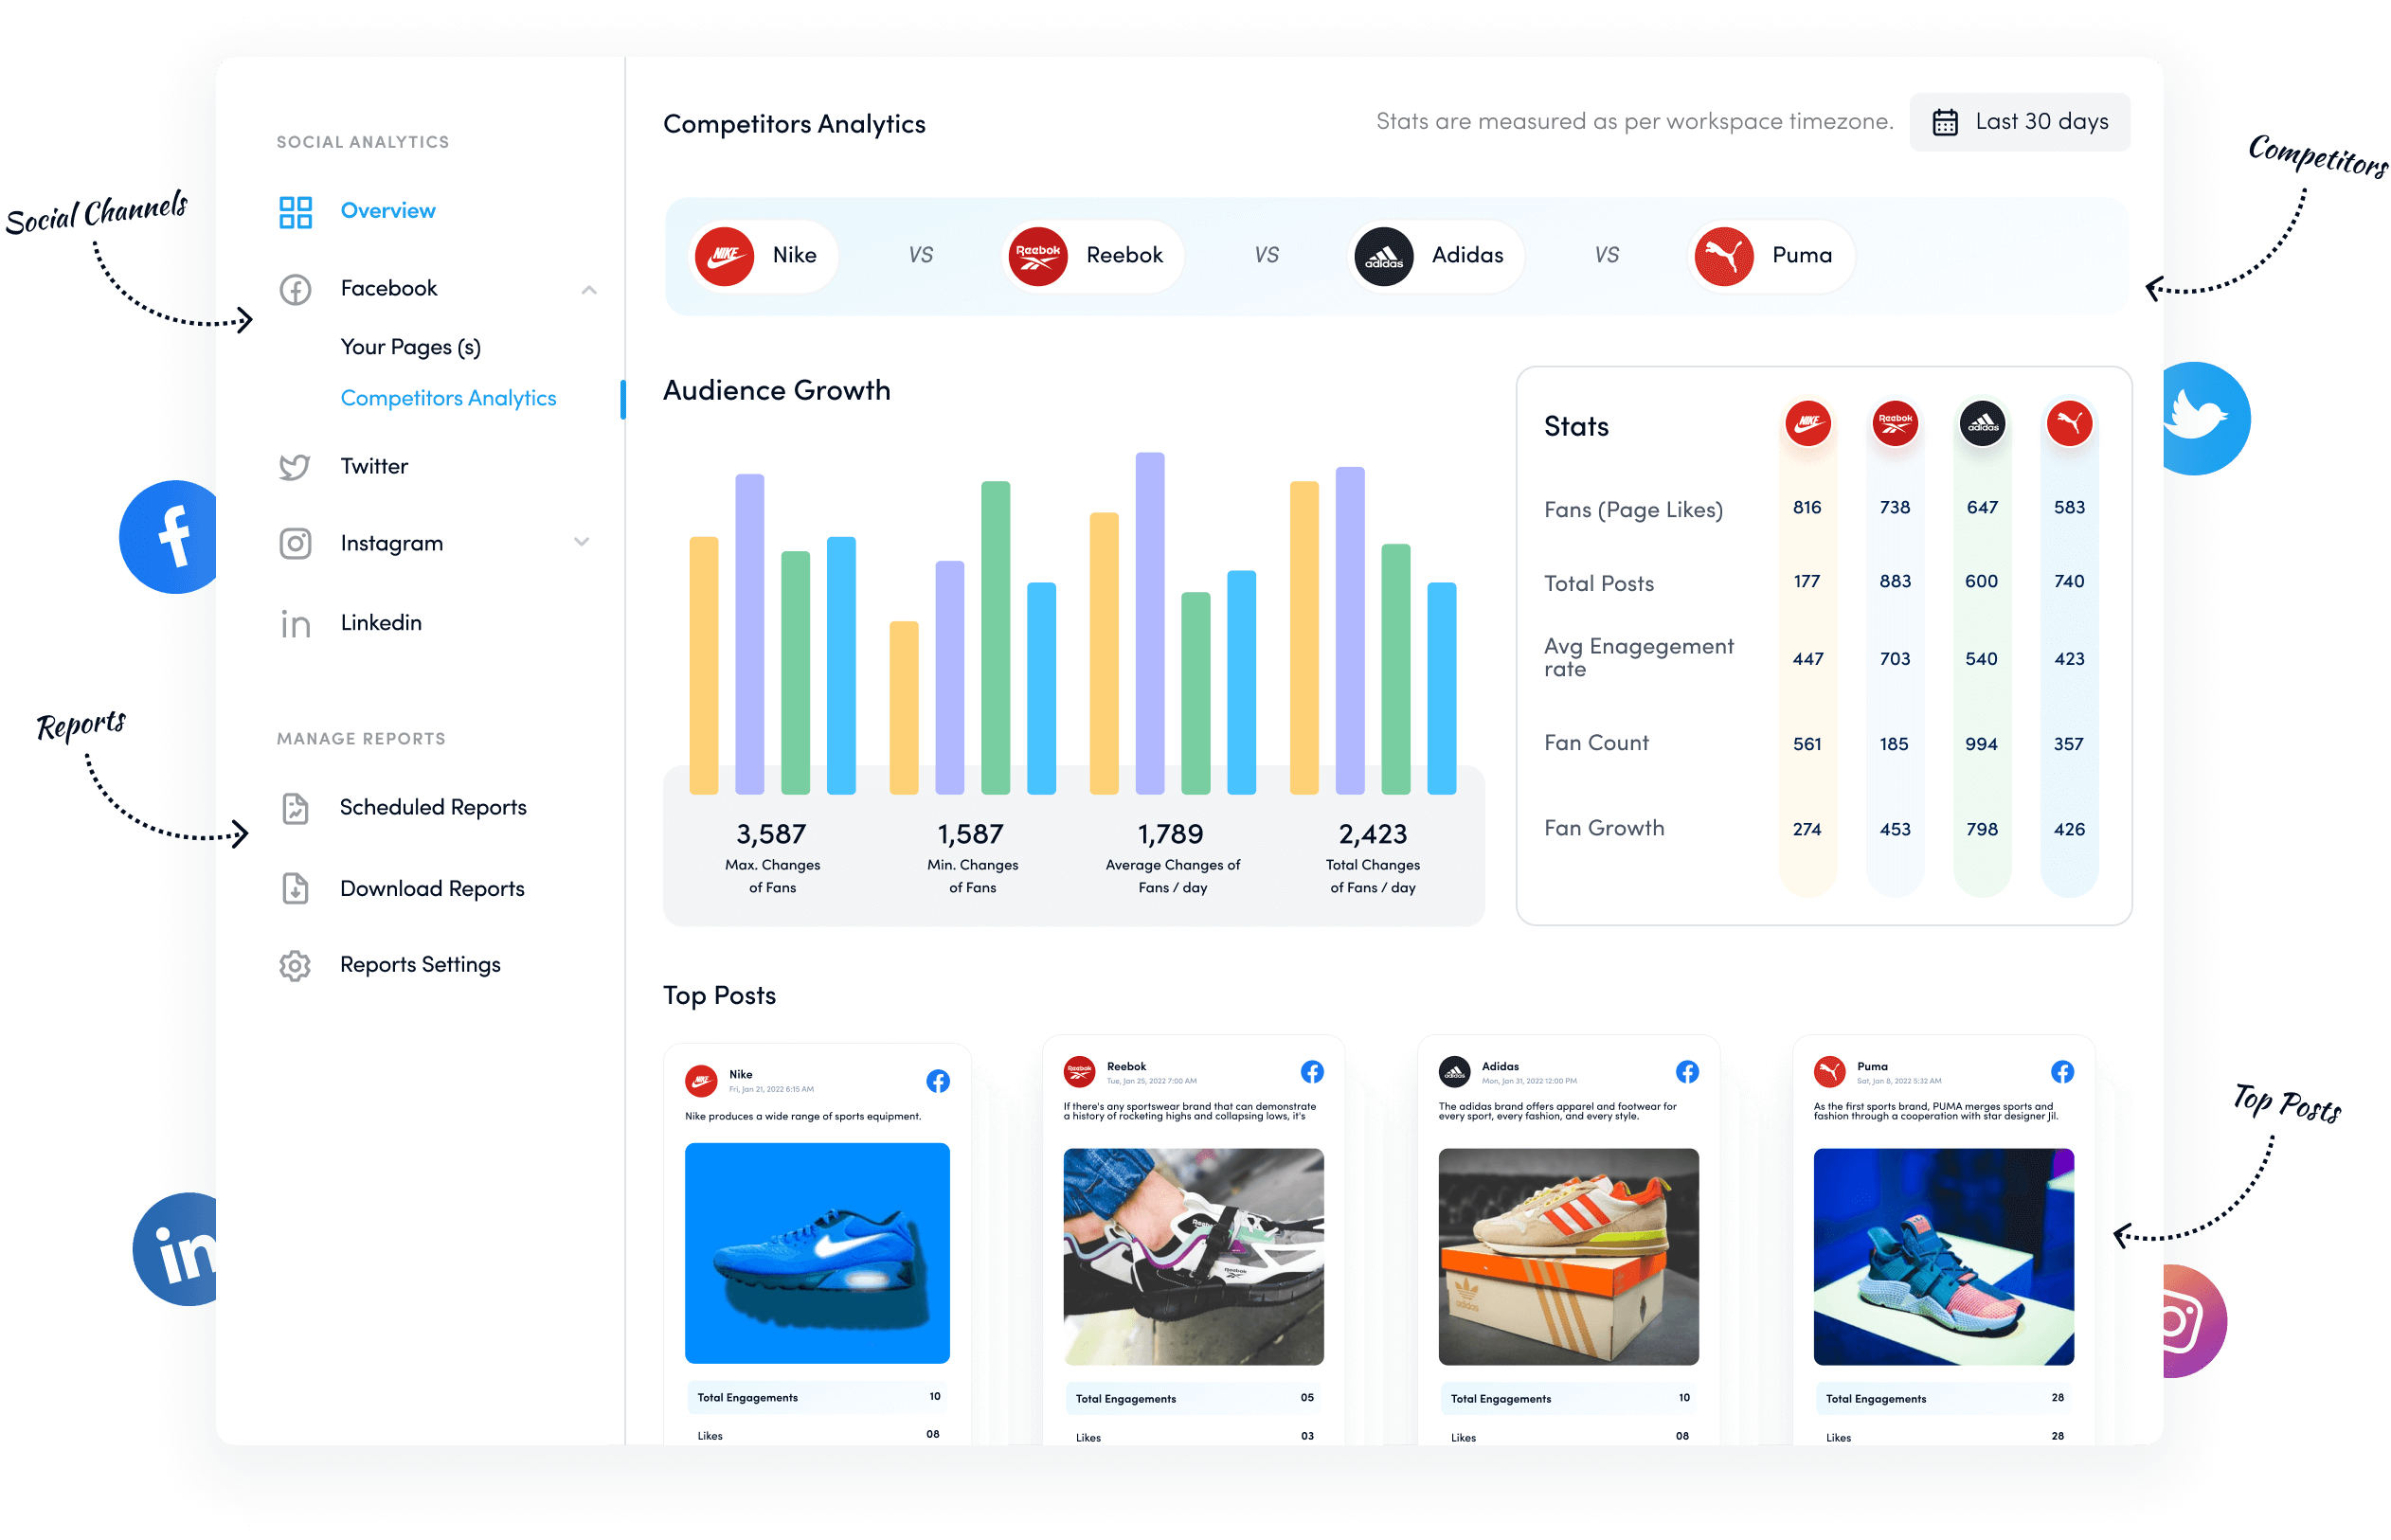
Every Google Ads metric answers one small question. Put them together, and they answer the big one: where is the money going, and is it coming back?
When a number moves, don’t react to it on its own. Trace it. Cost per conversion leads to CPC or conversion rate. CPC leads to Quality Score or competition. Conversion rate leads to the landing page. Follow the chain, and you’ll usually find the real problem within a few clicks.
The simplest way to measure Google Ads performance is to start with the handful of Google Ads metrics tied to your goal, check them on a steady schedule, and let the rest explain the changes.
The most important Google Ads metrics are the ones tied to your goal: conversions, cost per conversion, and ROAS. CTR, average CPC, impression share, and Quality Score come next, because they explain why those results change.
A metric is any number Google Ads reports, while a KPI is the metric you’ve chosen to measure success. Most accounts have dozens of metrics and two or three KPIs.
A good CTR depends on your industry, keywords, and campaign type, so no single number fits every account. Branded campaigns typically see much higher CTRs than generic ones. The most reliable benchmark is your own history on the same keywords.
Conversion rate measures the share of clicks that convert, while cost per conversion measures what each conversion costs. Cost per conversion equals average CPC divided by conversion rate, so a falling conversion rate pushes cost per conversion up.
Check spend and tracking daily, and review performance weekly. Daily numbers are too noisy for decisions, and conversion lag makes the most recent days look weaker than they are.
A good ROAS is any ROAS above your break-even point, which you find by dividing 1 by your profit margin. At a 25% margin, anything above 4 is profitable.
Plan 0 Days of Content in 0 Minutes
Create, schedule, publish and analyze your content across all your social media channels from one simple dashboard.
4.7 on Capterra • 16,500+ marketers trust ContentStudio
Saif Ali is a Content Marketing Strategist at ContentStudio with over five years of experience across SaaS, IT, and digital marketing. He specializes in SEO-led content, AI content creation, and social media strategy, and leads editorial review at ContentStudio, fact-checking and refining articles for accuracy, SEO, and a consistent brand voice.
View all posts by Saif AliRecommended for you
95% of marketers use AI. Only 39% see better performance. The gap isn’t the AI

How to run a holiday campaign calendar from chat with OpenClaw

10 social media goals for marketers

How to Make Money on Instagram in 2026 (9 Proven Ways)