
Black Friday vs. Cyber Monday: The real difference for software buyers
Oct 22, 202614 minutes

Written by
Arooj IshtiaqUpdated
A Short can hold viewers’ attention and still lose most people at the opening. It can also attract thousands of views without bringing many subscribers. YouTube Shorts analytics helps separate these problems, but only when you understand which viewers each metric describes.
A useful YouTube channel growth strategy gives each Short a purpose, and analytics shows whether your opening, delivery, and topic are doing their jobs. The most useful way to read those numbers is as a diagnosis: whether viewers stayed, how much they watched, and whether the content attracted subscribers. YouTube reports each of these through distinct viewing, retention, and subscription metrics, so no single number answers all three questions.
That makes the first step finding the Shorts-specific reports rather than interpreting a channel-wide average that mixes different video formats. This guide starts there, then explains what each metric does and does not measure, how to diagnose swipes, retention, and subscriber gains, and how to turn those findings into a repeatable testing routine, with a YouTube scheduler helping organize and publish each new batch of Shorts.
YouTube Studio provides a channel-level Shorts view as well as analytics for individual uploads. The channel view helps you spot patterns across your Shorts, while individual-video analytics is where you investigate a particular result.
On desktop, the channel-level route is YouTube Studio → Analytics → Content → Shorts.
The Content report includes Shorts views, likes, subscribers, discovery sources, and the percentage of occasions when viewers stayed past the initial seconds, and expanded reports are available through “See more” or Advanced Mode.
For an individual Short, its Analytics view provides a more focused investigation. The available cards and their placement can vary between desktop and mobile, so the report names matter more than memorizing one screenshot.
A practical review moves through five questions, each tied to a report or metric:
| Question | Report or metric to inspect |
|---|---|
| Where did viewers come from? | How viewers find your Shorts |
| Did they stay beyond the opening? | Stayed to watch or viewed versus swiped away |
| How much did interested viewers watch? | Average view duration and average percentage viewed |
| Where did attention weaken? | Audience retention graph, when available |
| Did the content attract subscribers? | Subscriber reporting for Shorts and the individual upload |
YouTube distinguishes Shorts-feed traffic from search, channel pages, browse features, and external sources, and those discovery contexts should stay visible during your analysis rather than disappearing behind one total view count.
The broader YouTube analytics guide covers channel-level measurement, so this guide concentrates on the viewing decisions that are unique to Shorts.
YouTube Shorts analytics measures several stages of viewing, and a playback start, a decision to stay, and sustained attention describe different outcomes. The table below sets out what each metric measures and, just as importantly, what it does not establish.
| Metric | What it measures | What it does not establish |
|---|---|---|
| Views | Legitimate playback starts under YouTube’s current counting method | That someone watched most of the Short |
| Engaged views | Occasions when viewers stayed past the initial seconds, excluding loops | Unique people or full-video completions |
| Stayed to watch | The percentage of occasions when viewers stayed past the initial seconds | Average percentage of the video watched |
| Average view duration | Average time watched among those who stayed, calculated from engaged views and corresponding watch time | The behavior of every person who encountered the Short |
| Average percentage viewed | Average share of the video watched among those who stayed | The percentage of viewers who finished |
| Subscribers | Subscription gains reported for the relevant content scope | That every subscriber will watch future uploads |
These distinctions follow YouTube’s current metric definitions and subscriber reporting. One detail deserves particular attention: the retention averages describe viewers who stayed beyond the opening. They do not simply average together every quick swipe and every longer watch.
A Short can therefore have a weak stayed-to-watch result and a strong average percentage viewed without any contradiction, because many people left immediately while the smaller audience that stayed watched extensively.
YouTube’s current documentation also reflects changes to view counting. Historical comparisons therefore need the metric definition and reporting period attached, particularly when an older report uses “views” differently from the current dashboard.
“Viewed versus swiped away” describes whether viewers stayed beyond the initial seconds or moved on. YouTube’s current documentation defines the positive side as “Stayed to watch,” and neither label means that the viewer completed the Short. This opening decision is also not the same as thumbnail click-through rate.
Thumbnail impressions and click-through rate measure a different interaction, in which someone saw a registered thumbnail impression and then watched, and they should not replace the Shorts-feed stay-or-swipe measure.
When your opening result weakens, the first hypothesis is not automatically “the whole video is bad.” The opening may fail to communicate the topic, make the outcome clear, or attract the audience the rest of the video serves. Those possibilities need testing against the footage and traffic context, because the percentage itself identifies a problem area, not its exact cause.
Average view duration measures time, while average percentage viewed expresses viewing depth relative to video length. For Shorts, both use engaged views and their corresponding watch time. An average percentage viewed above 100% is not proof that every viewer completed the video, since repeat viewing can contribute to viewing time and an average does not reveal how every individual behaved.
This distinction matters because creator discussions often treat “100% retention” as a completion guarantee or a distribution threshold. Those interpretations go beyond what the average establishes.
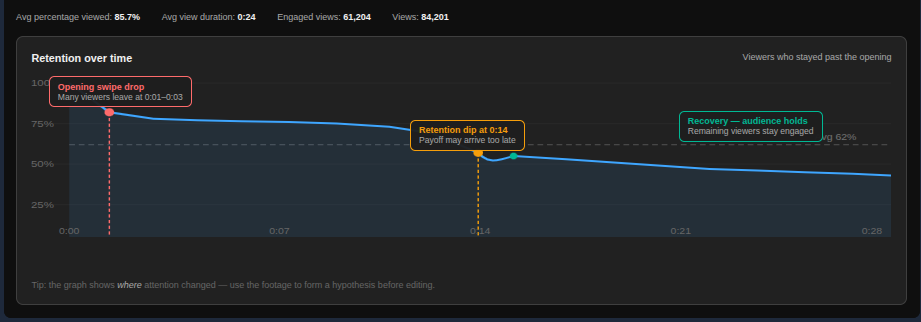
The retention graph adds timing to the investigation. A drop around a scene change suggests a different question from a drop just before the explanation finishes. The graph shows where attention changed, and the video itself helps you formulate a reason. From there, the most useful step is translating these signals into a specific editing or content hypothesis.
A reliable diagnosis considers the opening result alongside viewing depth, because either metric alone can point you toward the wrong change. The matrix below is an editorial testing framework, not a set of YouTube algorithm rules. “Strong” and “weak” refer to comparable Shorts on your own channel, not universal performance thresholds.
| Performance pattern | Working hypothesis | Next test |
|---|---|---|
| Weak stayed to watch, strong viewing depth | The opening loses potential viewers, but the content serves those who remain | A clearer first frame or more specific opening promise |
| Strong stayed to watch, weak viewing depth | The opening attracts attention, but delivery loses it | An earlier payoff or shorter explanation |
| Weak stayed to watch and weak viewing depth | The topic, audience, or execution may be misaligned | A narrower audience problem and a rebuilt opening |
| Strong viewing signals, few subscribers | The clip works on its own without establishing an ongoing reason to follow | A clearer connection to the channel’s recurring subject |
| Strong viewing signals, limited reach | The visible metrics do not explain the entire distribution outcome | Further comparison across traffic sources and similar uploads |
Creator discussions repeatedly describe Shorts with strong retention that stop gaining views. These examples illustrate the uncertainty; they do not establish a technical fault or reveal an algorithm threshold. Several situations deserve a closer look because they lead to different creative decisions.
Consider a hypothetical 30-second tutorial that receives a 40% stayed-to-watch result and an average percentage viewed of 110%. The interested audience watches extensively, but many people move on before engaging, so the next experiment should investigate the opening before replacing the useful explanation.
For example, a tutorial that begins with “Here’s another useful editing tip” could instead show the finished effect immediately, followed by the specific problem it solves. That change tests whether greater clarity attracts more of the right viewers.
A broader opening might attract more viewers while weakening viewing depth, so the objective is not simply a higher opening percentage but a better match between the opening promise and the content.
In the opposite pattern, a hypothetical Short earns a stronger stayed-to-watch result than similar uploads, but its retention graph falls sharply before the main answer. Possible explanations include repeated setup, an unclear transition, or a payoff that arrives too late, and the footage needs to support the hypothesis before an edit becomes justified.
A focused revision might move the answer ahead of background detail, and another might remove a sentence that restates the opening without adding information. The retention dip does not prove that a particular phrase caused the loss. It gives you a timestamp worth investigating and a variable worth changing.
Sometimes the viewing metrics look healthy while distribution remains limited. A strong retention result is encouraging, but it is not a complete explanation of reach. YouTube’s reports also separate discovery sources and viewing behavior, so the analysis should include more than one percentage. A small number of engaged views also warrants caution, since a few repeat viewers can produce an impressive average without giving you much evidence about a broader audience.
The comparison should account for:
A retention percentage alone cannot confirm a shadowban, predict another distribution wave, or justify deleting the upload.
The final diagnostic stage concerns audience growth, because a Short that people watch is not necessarily a Short that makes them subscribe. YouTube’s content reporting shows subscribers gained from different formats, including Shorts, which helps separate Shorts-driven subscription gains from those associated with other content types and sources. For individual-upload analysis, the relevant video-level subscriber figure matters more than the channel’s subscriber change on publication day, since multiple videos and subscription sources can contribute to the channel’s result.
Subscriber totals answer “How many?” A normalized comparison adds another question: “How efficiently did this Short attract subscriptions relative to its engaged viewing?” The following analyst-created measure can help:
Subscribers gained per 1,000 engaged views = (Subscribers gained ÷ Engaged views) × 1,000
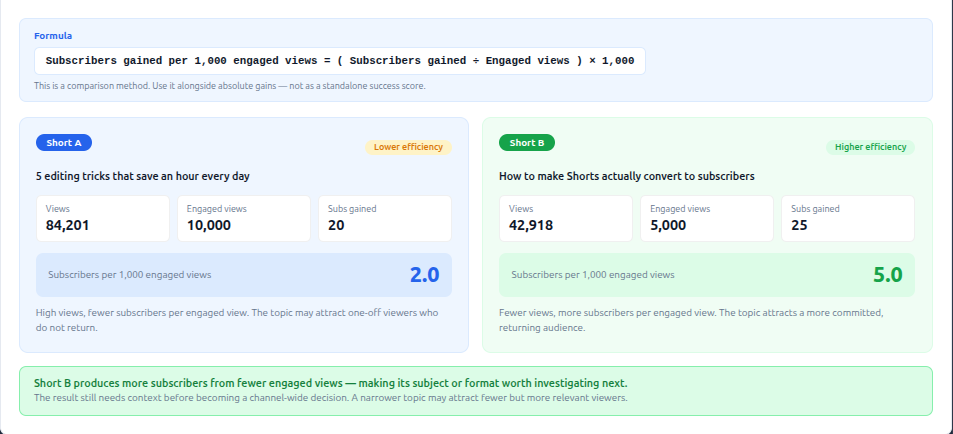
This is not a named YouTube metric or a unique-viewer conversion rate. It is a comparison method, and both inputs must cover the same upload and reporting period. A hypothetical comparison shows why absolute gains and efficiency belong together.
| Metric | Short A | Short B |
|---|---|---|
| Engaged views | 10,000 | 5,000 |
| Subscribers gained | 20 | 25 |
| Subscribers per 1,000 engaged views | 2 | 5 |
Short B produces more subscribers from fewer engaged views. That makes its subject or format worth investigating, but the result still needs context before becoming a channel-wide decision. The difference between viewing appeal and subscription appeal is especially important here.
A one-off clip may answer a question completely without explaining why the viewer should return, and another may attract people interested in a topic the channel rarely covers.
Useful questions include whether the Short reflects the channel’s main subject, whether related uploads exist, and whether the viewer can recognize the continuing value.
For example, a single spreadsheet shortcut offers immediate utility, while a recognizable series solving recurring reporting problems provides a more concrete reason to subscribe.
A subscription request should also fit the viewing experience. A generic appeal that interrupts the answer may work against the attention you are trying to preserve.
A lower-view Short can still deserve a place in the publishing plan. A narrower topic may attract fewer viewers, but a more relevant audience, and its value becomes clearer when subscriber gains are assessed alongside engaged views, production effort, and the purpose of the channel.
Shorts analytics should help identify useful content patterns rather than turn every upload into a contest for the largest view count. A healthy review can preserve both reach-oriented Shorts and more focused subscriber-building content, and because their roles differ, their success criteria should differ too.
The remaining task is turning these findings into a repeatable publishing and reporting workflow without overstating what each tool measures.
YouTube Studio and ContentStudio serve complementary roles: Studio supplies the native Shorts-specific investigation, while ContentStudio supports documented channel reporting, engagement review, and publishing organization. The reporting boundary should remain explicit.
| Task | Appropriate tool or limitation |
|---|---|
| Assessing stayed-to-watch and engaged views | YouTube Studio provides the native Shorts metrics. |
| Investigating retention timing | YouTube Studio’s video analytics is the diagnostic starting point. |
| Reviewing channel views, watch time, and average view duration | ContentStudio documents these channel-level metrics. |
| Monitoring subscriber trends | ContentStudio documents cumulative subscriber trends and daily changes. |
| Reviewing individual-post engagement | ContentStudio documents likes, dislikes, comments, shares, and engagements. |
| Sharing recurring reports | ContentStudio documents PDF export, sending, and scheduling. |
| Claiming native swipe rates or Shorts retention curves in ContentStudio | The inspected support documentation does not establish these capabilities. |
| Planning and publishing subsequent Shorts | ContentStudio supports scheduling and automatic publishing. |
ContentStudio’s documentation says data may be up to three days old, processing runs every 24 hours, and reports use the workspace time zone. These details matter when reconciling its figures with Studio, especially for a recent upload.
A practical experimentation process keeps the diagnosis attached to the next creative decision:
For example, an opening revision might improve stayed to watch while reducing average percentage viewed. That result could mean the opening attracted a broader audience than the explanation served, and it should prompt another investigation, not an automatic declaration of success. A simple test log keeps the learning usable:
| Field | Example entry |
|---|---|
| Observed problem | Weak opening engagement compared with similar tutorials |
| Hypothesis | The first frame does not show the outcome clearly |
| Main change | Finished result appears before the explanation |
| Primary comparison | Stayed to watch |
| Supporting checks | Engaged views, viewing depth, subscriber gains |
| Decision | Further test, retain the approach, or revise the hypothesis |
The workflow can then move into scheduling the next Shorts, with the creative change and review date recorded alongside the publishing plan.
The best next step is one focused test: a clearer opening for high swipes, an earlier payoff for weak retention, or a stronger reason to follow for low subscriber gains. Comparable Shorts provide a better baseline than universal benchmarks.
YouTube Studio helps you investigate the problem, while ContentStudio helps organize reporting and publishing. Your next batch of Shorts is an opportunity to put one finding into practice, with the hypothesis recorded before publishing and the results reviewed afterward.
There is no universal percentage that guarantees wider distribution. A useful benchmark is your own performance across comparable Shorts. A higher viewed rate means more viewers stayed beyond the opening, but it should be assessed alongside viewing depth rather than treated as a standalone success score.
A useful retention benchmark accounts for video length and your channel’s previous results. Similar-length Shorts provide a more meaningful comparison than a single target applied to every upload. The retention curve also matters: an average can conceal a sharp drop before the main answer.
Shorts retention averages describe viewers who stayed beyond the initial seconds, not everyone who encountered the upload. A smaller interested audience can therefore watch extensively while many others swipe away. High retention alone does not explain or guarantee broader reach.
Repeat viewing can push average viewing time beyond the Short’s original length. An average percentage viewed above 100% is therefore consistent with rewatching, but it does not mean every viewer finished the video or watched it twice.
A plateau means the upload is receiving fewer new views, but analytics may not reveal one definitive cause. A useful investigation covers opening engagement, retention, and discovery sources. A fixed view ceiling or one impressive metric does not establish an algorithm rule, technical fault, or shadowban.
Plan 0 Days of Content in 0 Minutes
Create, schedule, publish and analyze your content across all your social media channels from one simple dashboard.
4.7 on Capterra • 16,500+ marketers trust ContentStudio
Arooj Ishtiaq is a Content Marketing Strategist with 5+ years of experience writing about social media, SaaS, and AI. At ContentStudio, she creates practical guides, tutorials, and how-to content that help marketers navigate social media trends, sharpen their strategies, and get more from their content.
View all posts by Arooj IshtiaqRecommended for you
Black Friday vs. Cyber Monday: The real difference for software buyers

Black Friday social media post ideas: Captions and posting plan for 2026

Black Friday and Cyber Monday social media checklist 2026

Cyber Monday social media post ideas: Captions, hashtags & retargeting posts